Ripple Price Analysis: Following 25% Weekly Gains XRP Facing Major Resistance
XRP/USD – Bulls Struggling To Break Descending Trend Line Resistance.
Key Support Levels: $0.434, $0.4, $0.365.
Key Resistance Levels: $0.47, $0.5, $0.556.
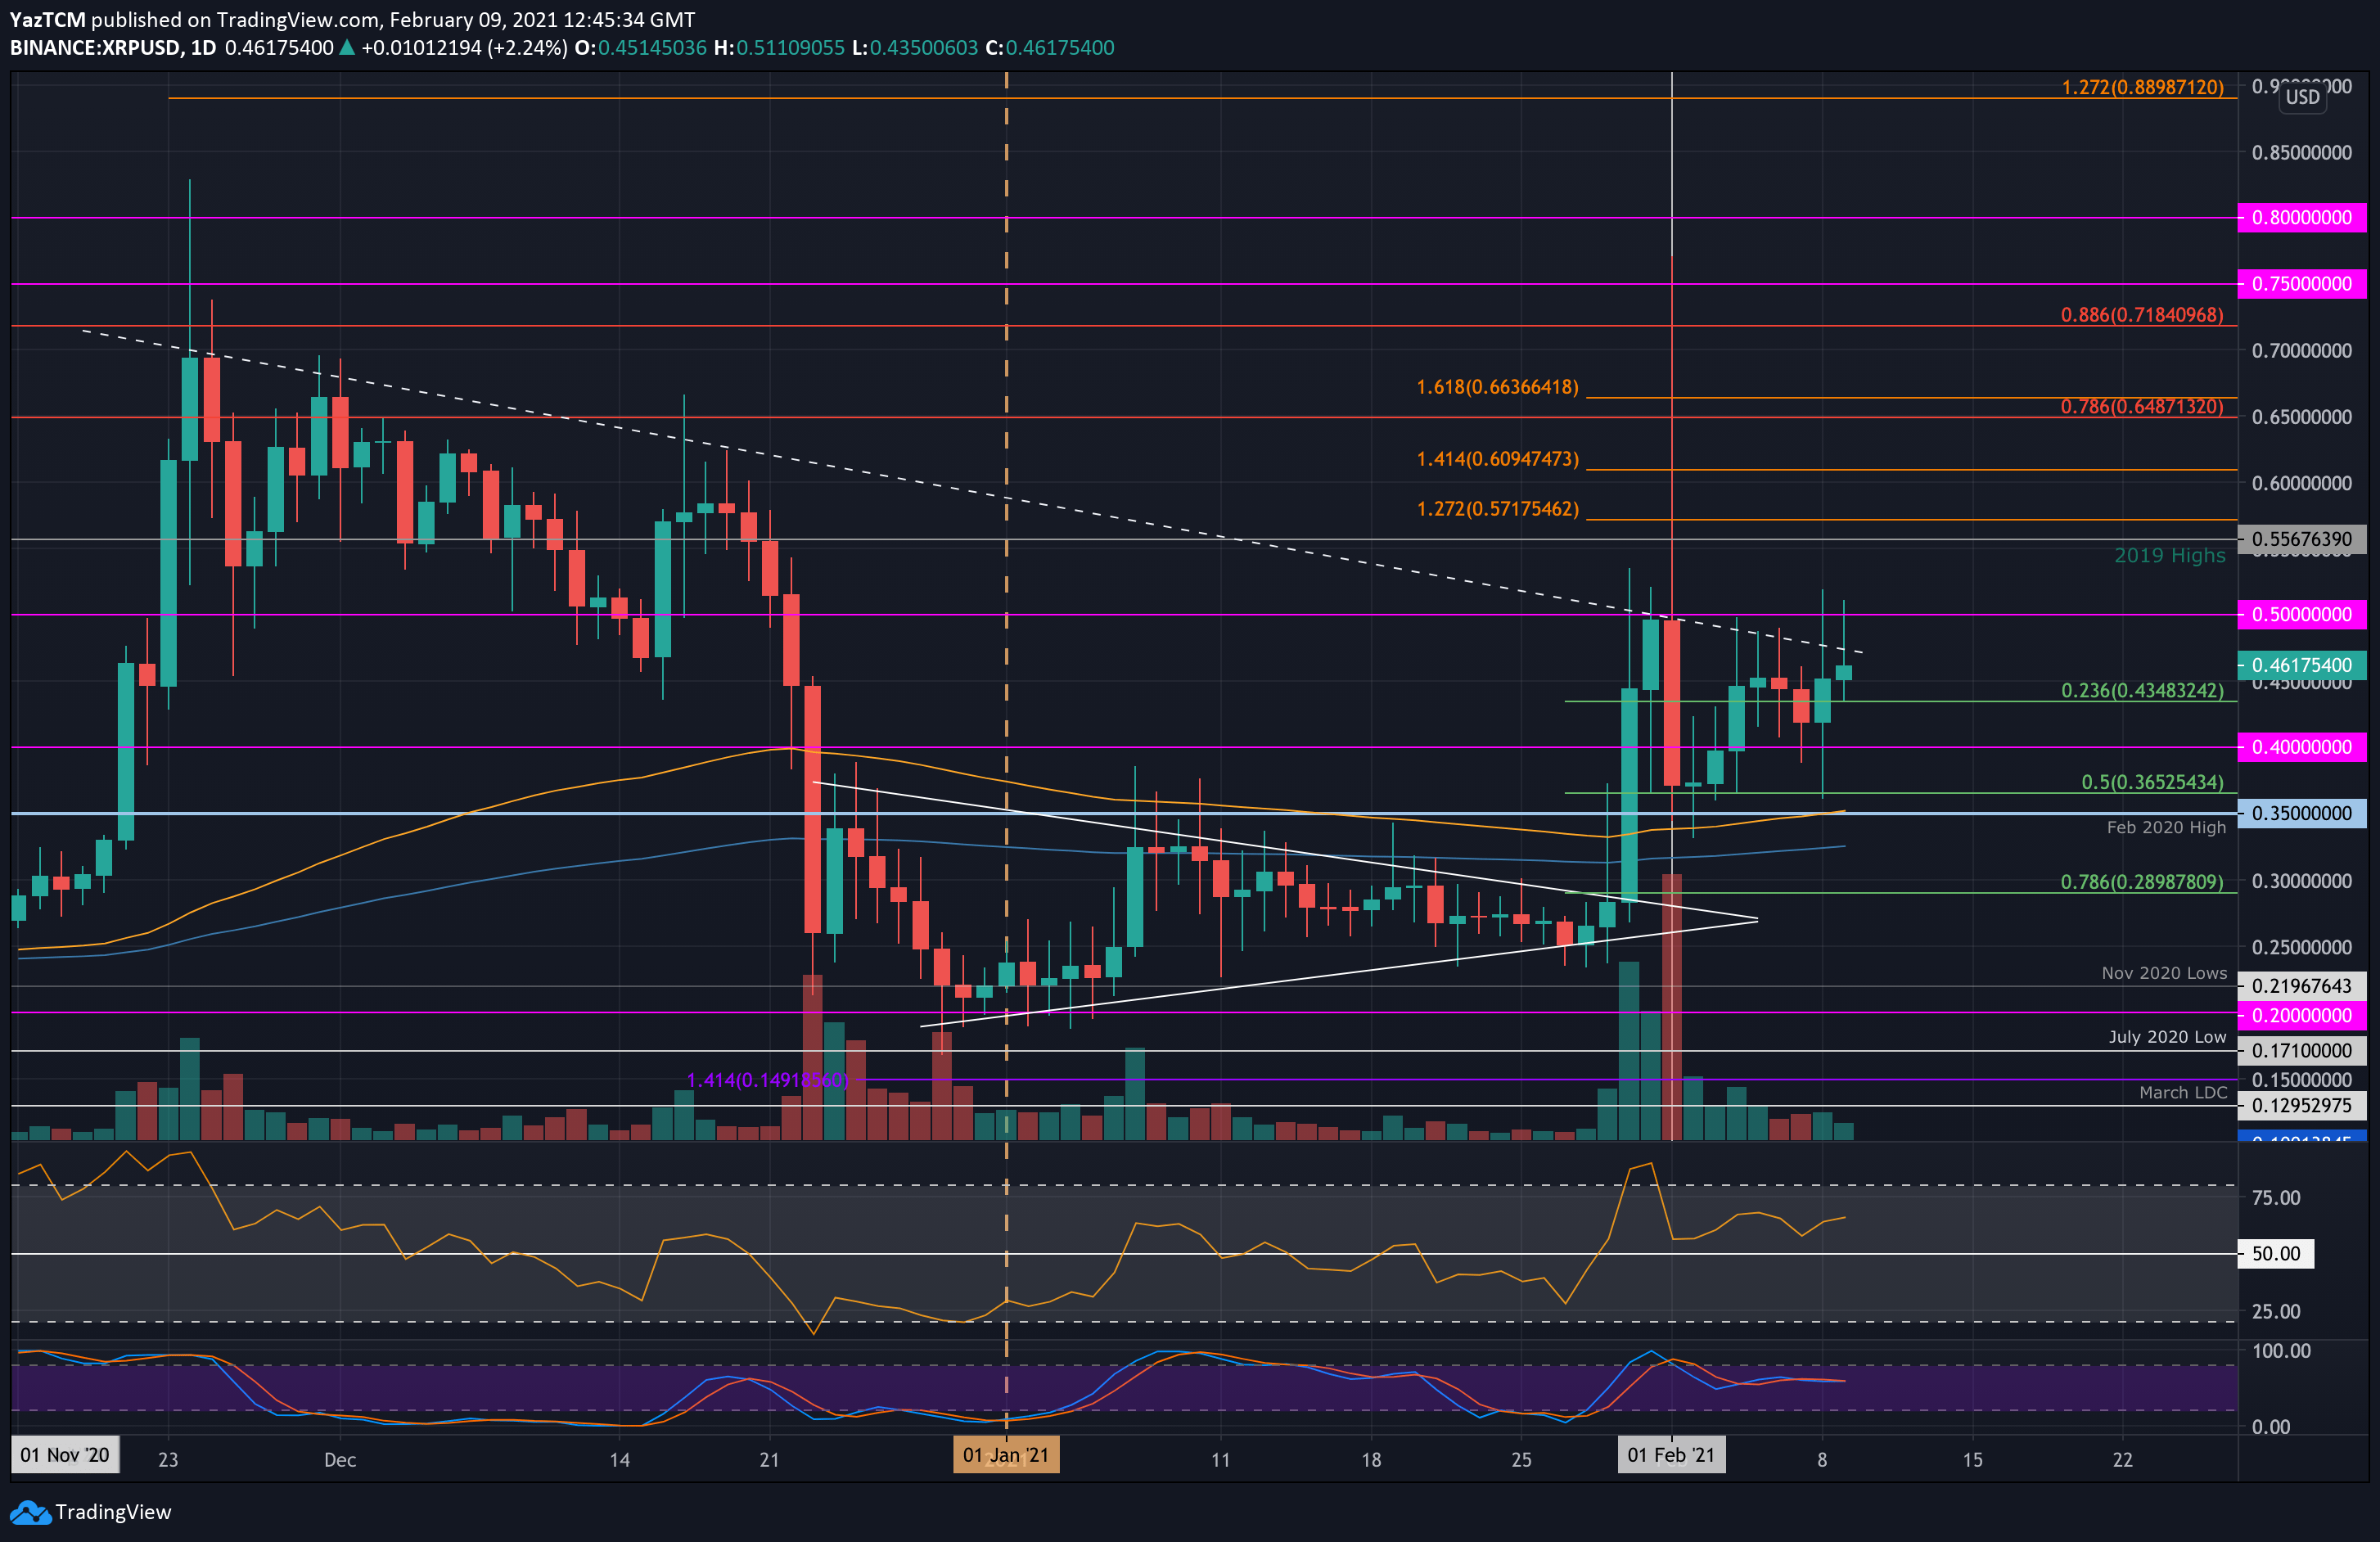
XRP is up by 25% over the past week of trading. Last week, it surged higher from $0.365 as it pushed into resistance at a descending trend line that dates back to early December. It could not close above this trend line, making XRP roll over during the weekend.
Yesterday, XRP spiked as low as $0.365 (.5 Fib), but it quickly recovered and ended up closing the day at $0.45. Today, the cryptocurrency had increased above $0.5 but dropped lower as it struggles with the descending trend line.
XRP-USD Short Term Price Prediction
Looking ahead, the first level of resistance lies at the descending trend line, around $0.47. This is followed by $0.5, $0.556 (2019 Highs), $0.571 (1.272 Fib Extension), and $0.609 (1.414 Fib Extension).
On the other side, the first support lies at $0.434 (.236 Fib). This is followed by $0.4, $0.365 (.5 Fib), and $0.35 (100-days EMA). Added support lies at $0.32 (200-days EMA) and $0.3.
The daily RSI remains above 60, indicating weak bullish momentum in the market. If it pushes higher toward 80, it will provide enough momentum for the current descending trend line to be penetrated.
XRP/BTC – Bulls Battle To Remain Above 1000 SAT.
Key Support Levels: 1000 SAT, 980 SAT, 867 SAT.
Key Resistance Levels: 1200 SAT, 1300 SAT, 1550 SAT.
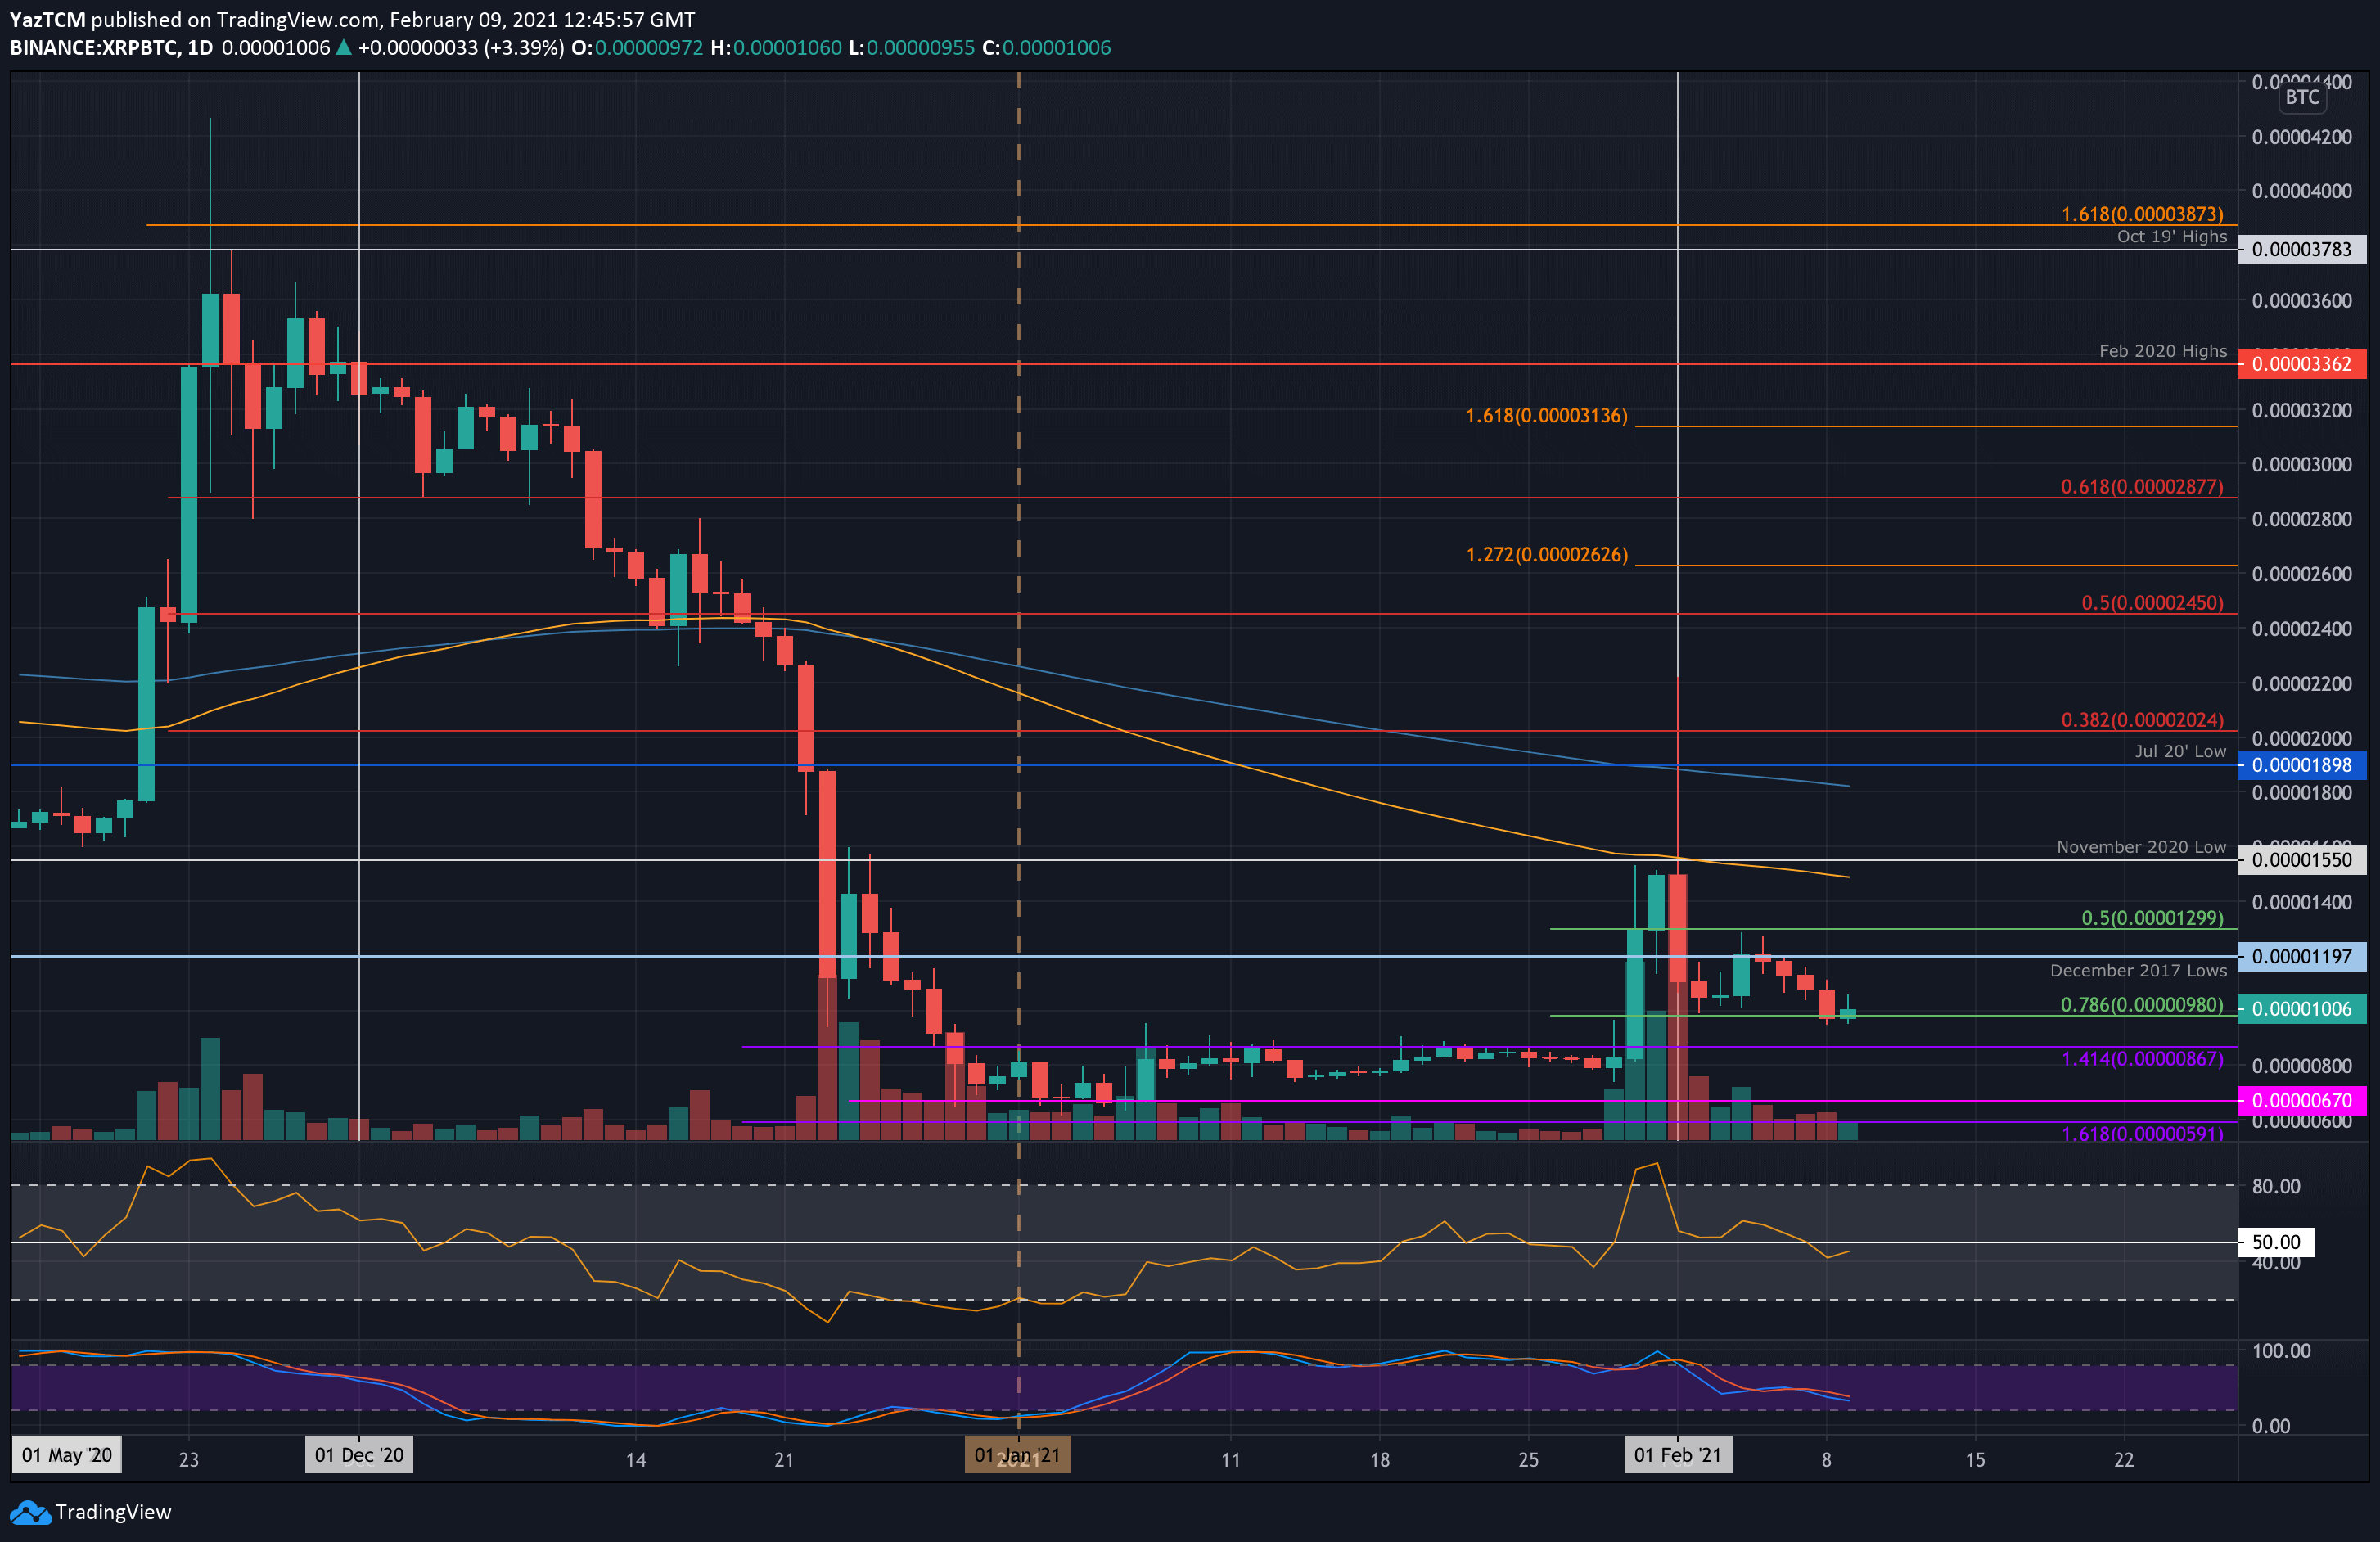
XRP is starting to show some weaknesses against Bitcoin. It had met resistance at 1300 SAT last week and has been slowly grinding lower.
Yesterday, it dropped beneath 1000 SAT but managed to finds support near 980 SAT (.786 Fib Retracement). Today, it is battling to remain above 1000 SAT, but it is not looking too promising with BTC hitting ATHs.
XRP-BTC Short Term Price Prediction
Moving forward, if XRP slips beneath 1000 SAT, the first support lies at 980 SAT. This is followed by 867 SAT (upper boundary of previous range), 750 SAT, ad 670 SAT (2021 support).
On the other side, the first resistance lies at 1200 SAT (December 2017 lows). This is followed by 1300 SAT, 1550 SAT (November 2020 Lows), and 1800 SAT (200-days EMA).
The RSI is beneath the midline, indicating weak bearish momentum within the market. If it continues to drop lower, XRP will likely head beneath 1000 SAT.


