Ripple Price Analysis: Can XRP Take Down $3 After 8% Daily Surge?
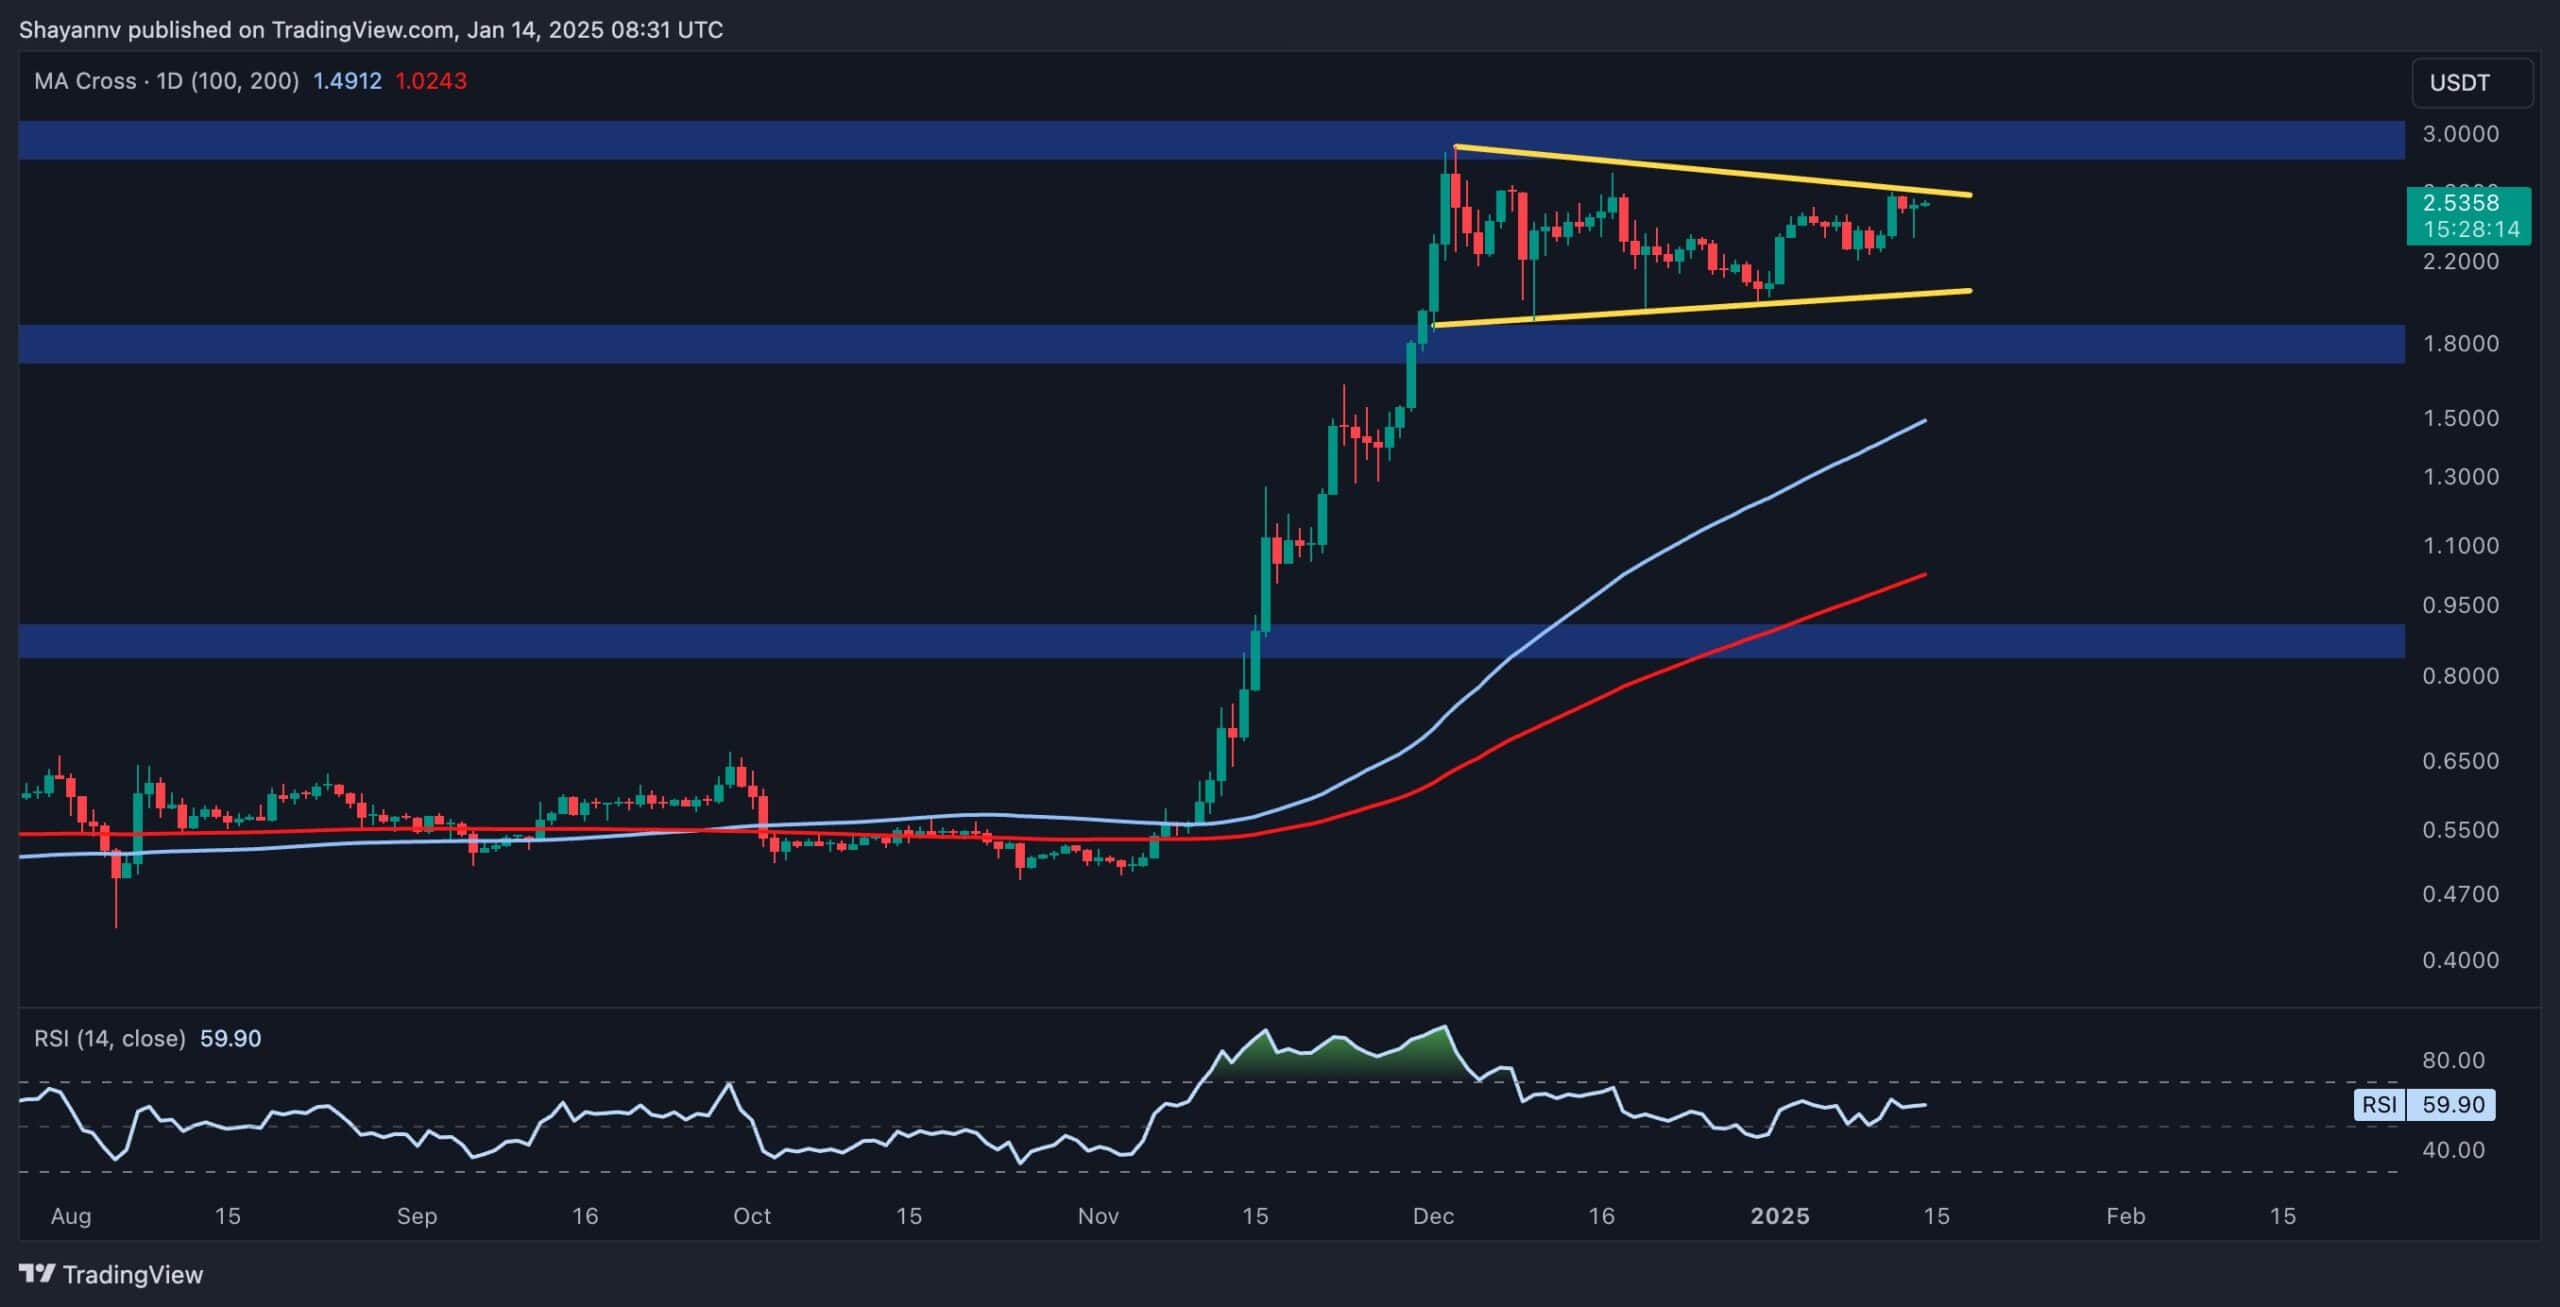
Ripple’s price has been steadily rising, nearing the upper boundary of the sideways wedge pattern.
A breakout above this critical threshold could ignite bullish momentum, with buyers targeting the $3 resistance zone.
XRP Analysis
By Shayan
The Daily Chart
RP recently rebounded from the wedge pattern’s lower boundary at $2, demonstrating strong buyer activity. The subsequent rally has brought the asset near the upper boundary at $2.5, a significant dynamic resistance level.
If it breaks above this boundary, bullish momentum is expected to increase, potentially driving the price toward the $3 resistance zone, a crucial psychological and technical level. The coming days will be pivotal, as the price action near $2.5 will dictate Ripple’s short-term trajectory. A successful breakout could set the stage for a sustained bullish trend.
The 4-Hour Chart
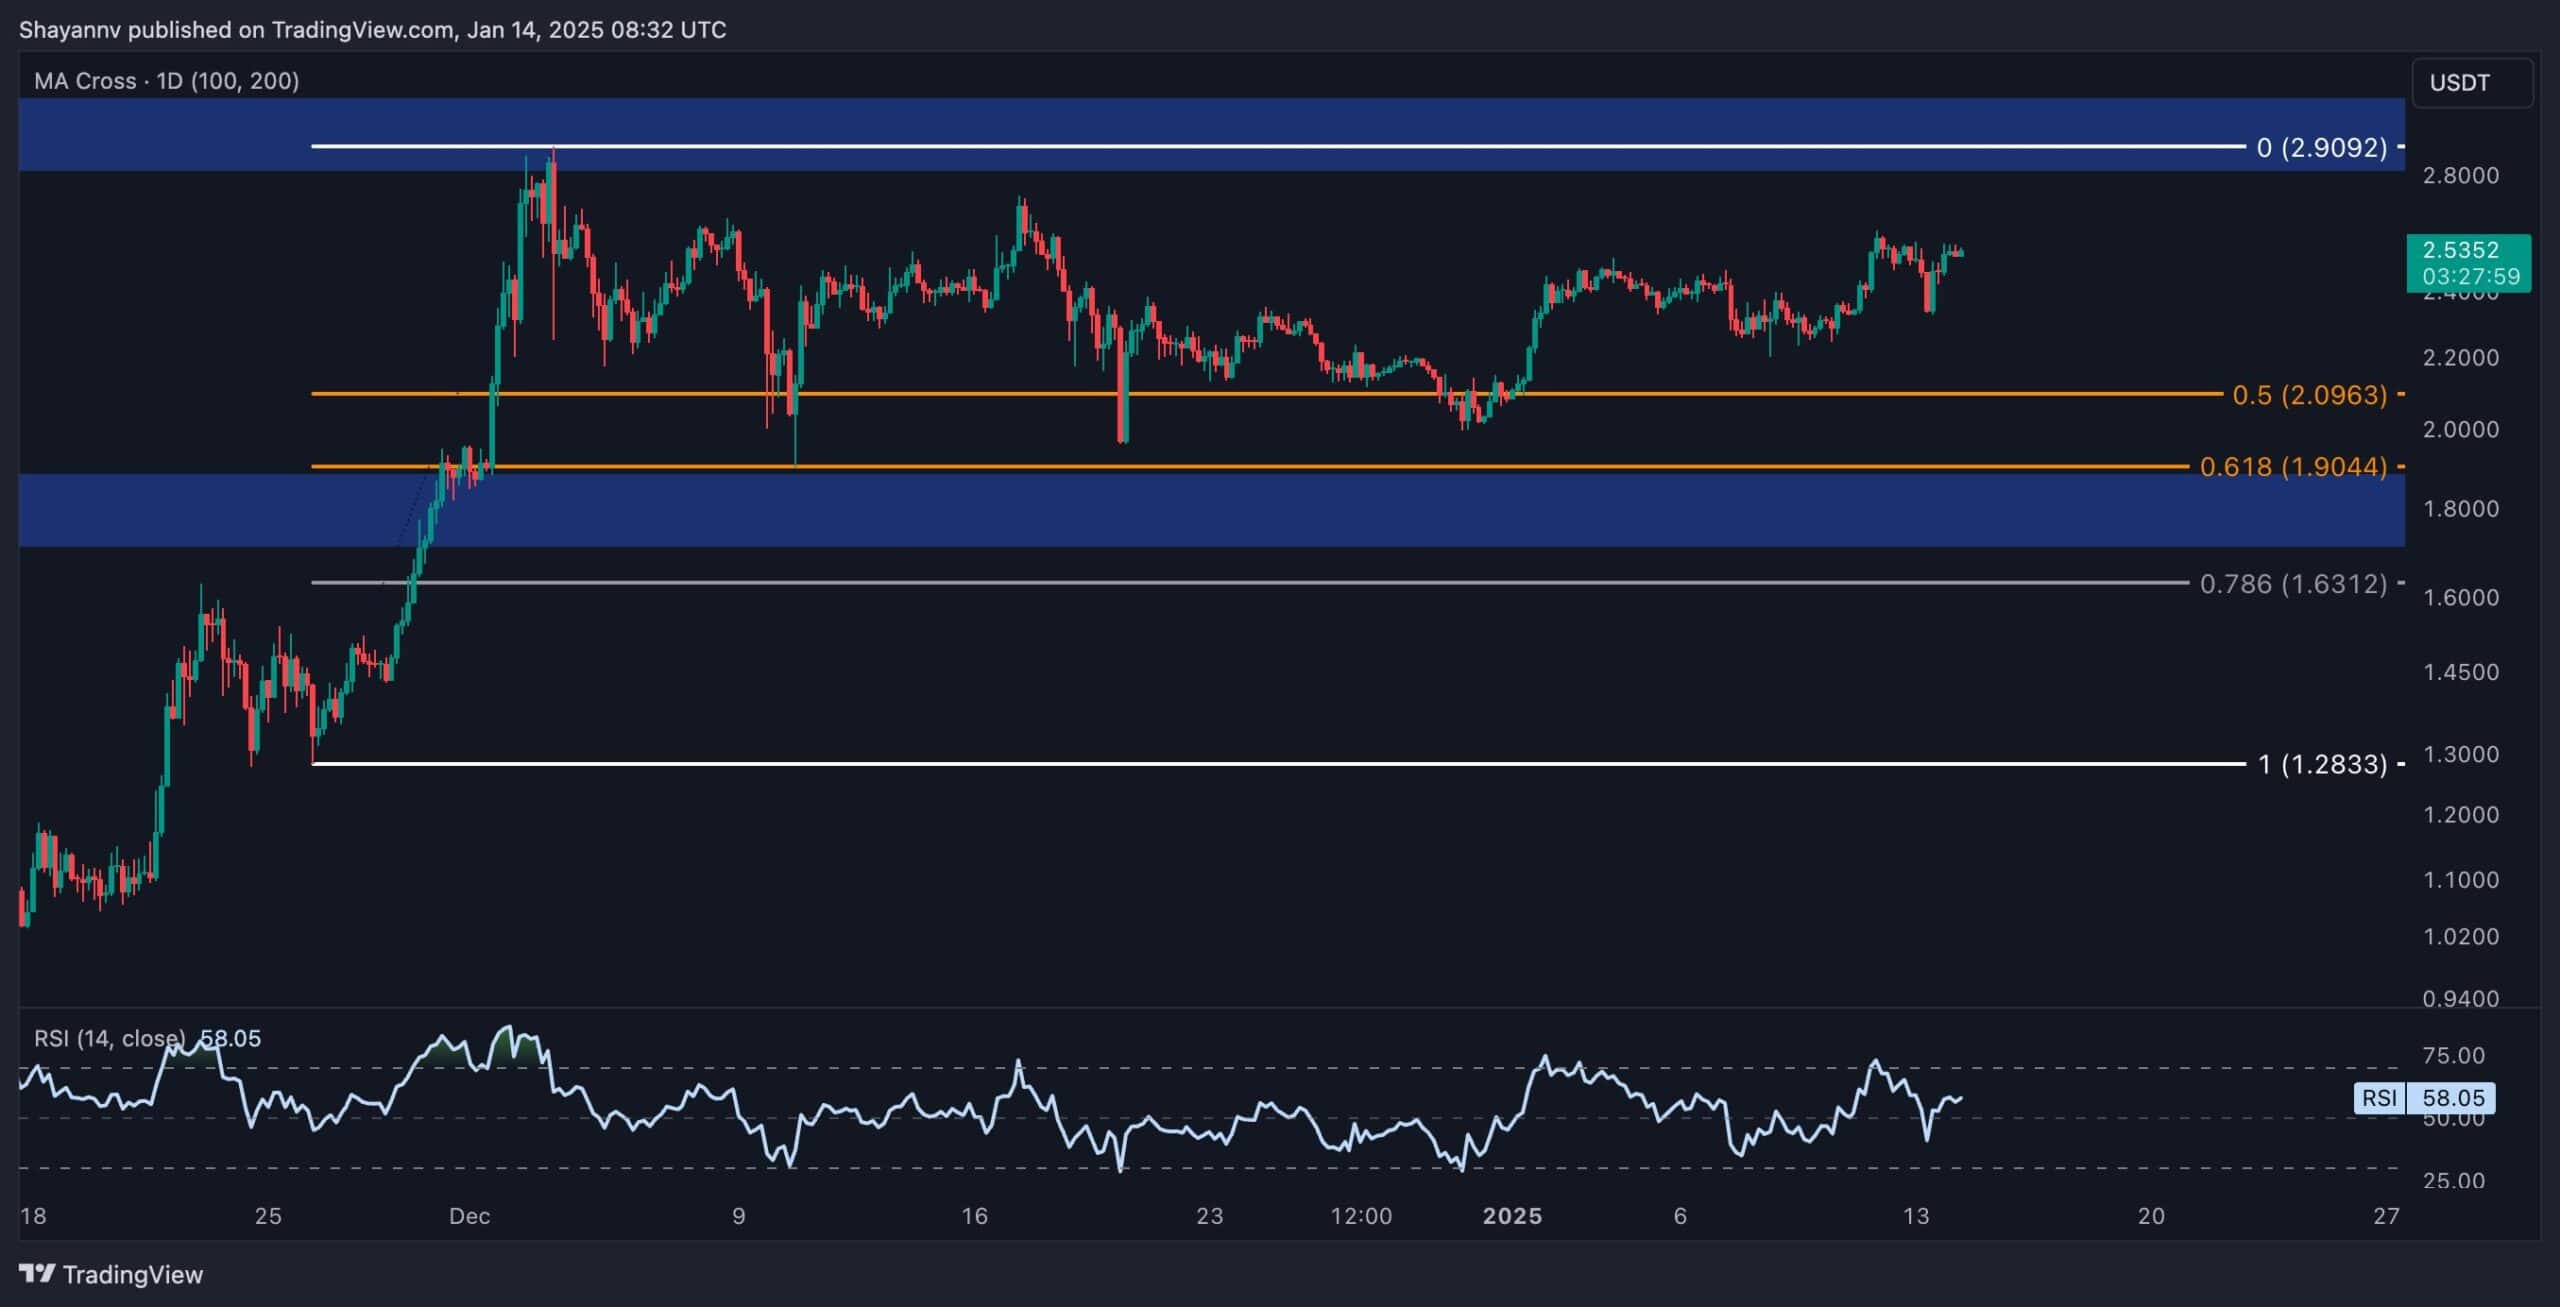
XRP’s bullish market structure is evident in the lower timeframe, with the price forming higher highs and higher lows. Strong buying activity near the 0.5-0.618 Fibonacci retracement levels has fueled this upward movement.
Despite the steady rally, Ripple remains trapped within the $2-$3 range, with a breakout required for a fresh trend. The price is expected to climb toward the $3 threshold, a level critical for validating the bullish continuation. However, consolidation within this range is likely to persist without a breakout.
The post Ripple Price Analysis: Can XRP Take Down $3 After 8% Daily Surge? appeared first on CryptoPotato.


