Ripple Price Analysis: Bears Take Over As XRP Pulls Back To $0.26
XRP saw a small decrease of around 1% over the past 24 hours and it currently trades at $0.2677. This follows a more significant drop of 7.23% over the past week.
Nevertheless, XRP remains the third-largest cryptocurrency with a market cap of $11.71 billion.
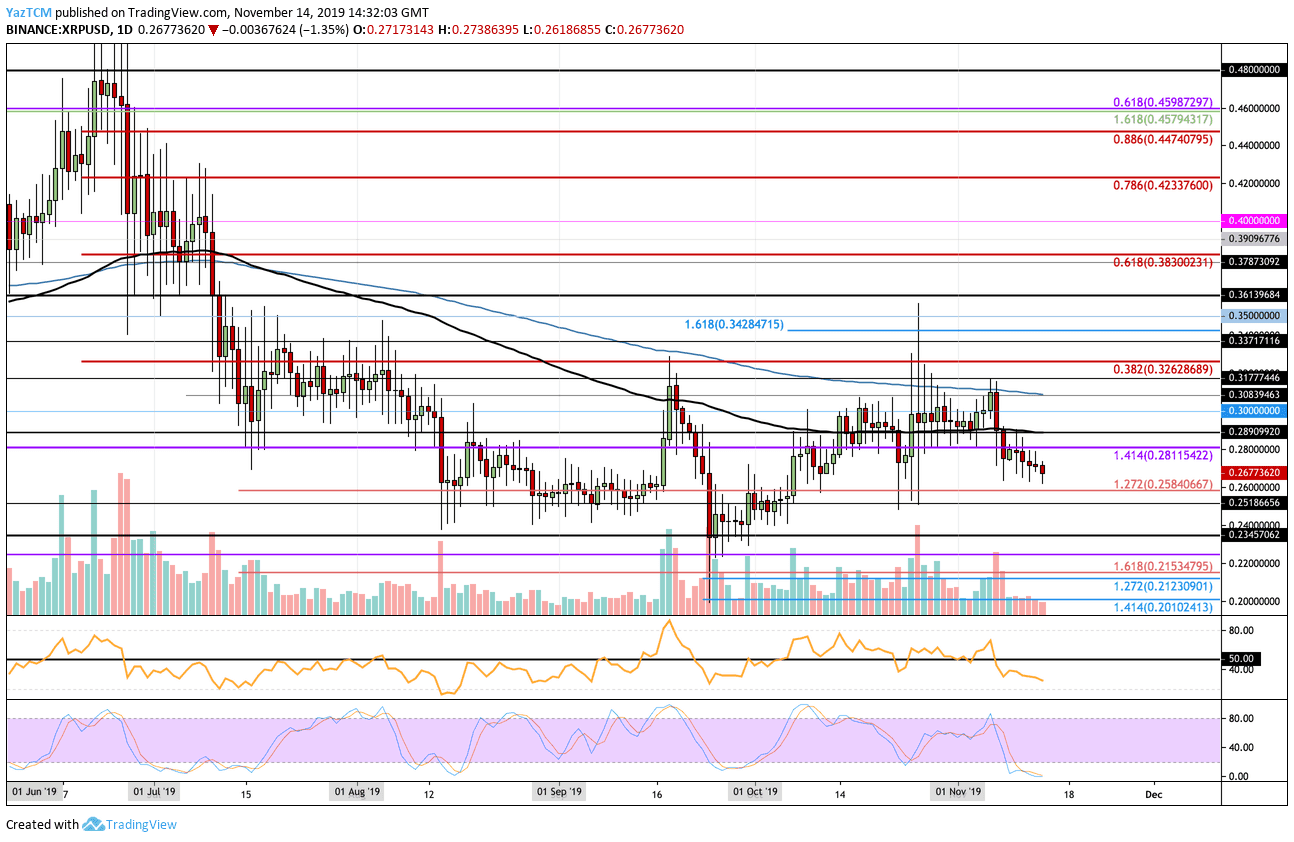
Looking at the XRP/USD 1-Day Chart:
- Since our previous XRP/USD analysis, the cryptocurrency continued to pull back, breaking below $0.28 and $0.27 to reach the current level of $0.2677.
- From above: The nearest level of resistance is located at $0.28. Above this, resistance is found at $0.2811, $0.2890 (100-days EMA), $0.29, and $0.30. Higher resistance lies at $0.308 (200-days EMA), $0.3177, and $0.3262 (bearish .382 Fib Retracement).
- From below: The nearest level of support lies at $0.26. Beneath this, support can be expected at $0.2585, $0.2518, and $0.25. Beneath this, support is found at $0.245, $0.24, $0.2345, and $0.2245.
- The trading volume has been diminishing over the past few days.
- The RSI is beneath the 50 level which shows that the sellers control the market momentum. However, the Stochastic RSI is in oversold conditions as we wait for a bullish crossover signal to send the market higher.
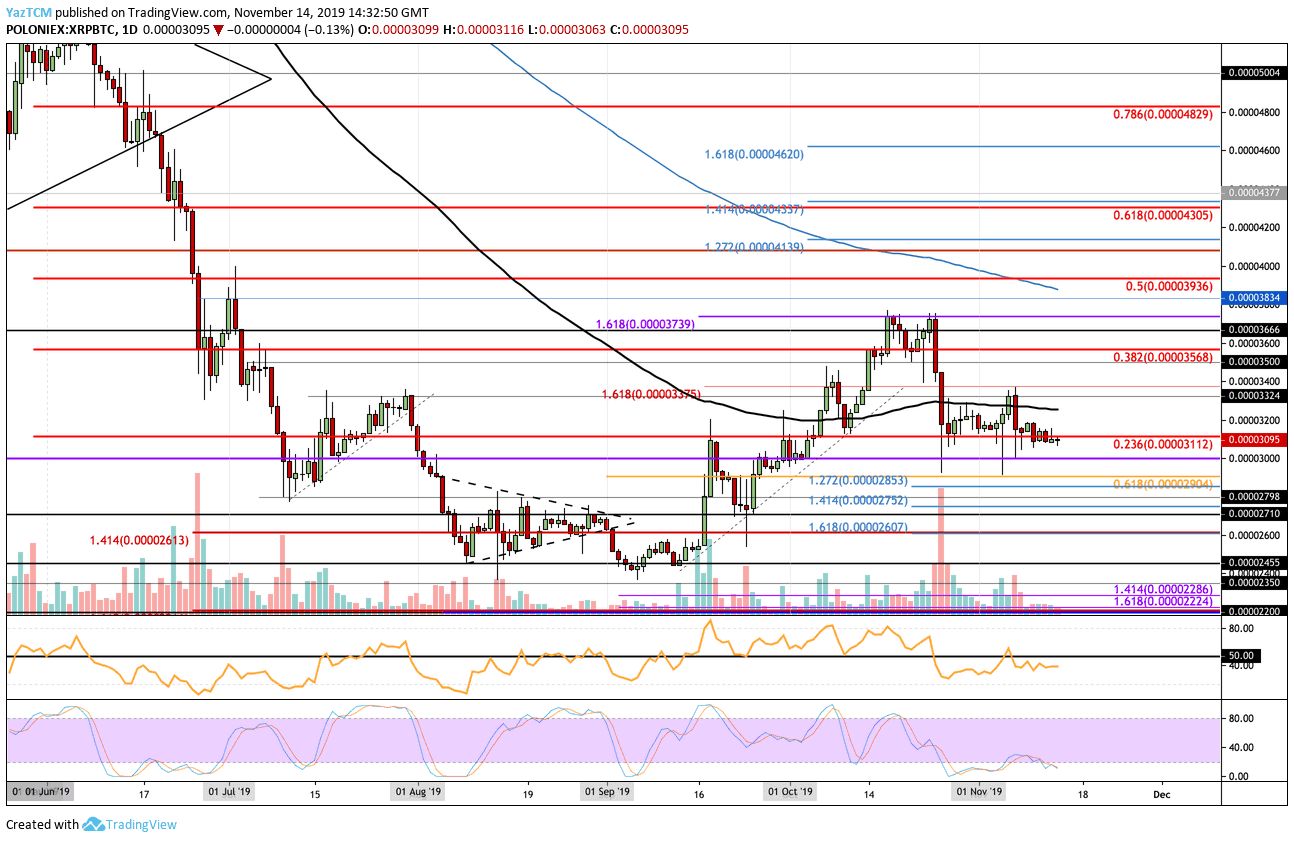
Looking at the XRP/BTC 1-Day Chart:
- Against Bitcoin, XRP remained fairly static as it stayed around the 3100 SAT level. The cryptocurrency is trading sideways as we wait for the market to dictate the next move.
- From above: The nearest level of resistance lies at 3200 SAT. Above this, resistance is expected at 3250 SAT (100-days EMA), 3324 SAT, 3375 SAT, and 3500 SAT. This is followed by resistance at 3568 SAT (bearish .382 Fib Retracement), 3666 SAT, and 3739 SAT (October highs).
- From below: The nearest level of support lies at 3000 SAT. Beneath this, support is located at 2904 SAT, 2853 SAT, 2752 SAT (downside 1.272 Fib Extension), 2710 SAT, and 2600 SAT (downside 1.618 Fib Extension).
- The trading volume remains very low when compared to October.
- The RSI is marginally beneath the 50 level to show the bulls weakly control the momentum. However, the Stochastic RSI is in overbought conditions as we wait for the bullish crossover signal higher.
The post Ripple Price Analysis: Bears Take Over As XRP Pulls Back To $0.26 appeared first on CryptoPotato.