Ripple Price Analysis April 11: XRP Plummets Following Bitcoin’s Sentiment, Can The Bulls Maintain $0.33?
Ripple has seen a troublesome 24 hour period after XRP price action dropped sharply by a total of 7% bringing the coin’s price down to the $0.33 area at the time of writing. This price drop is mostly attributed to Bitcoin falling from its highs back into the $5,000 support area.
XRP had made attempts to break above a long-term price channel but had failed to succeed and got rejected. As of now, the coin is battling to remain above the lower boundary of the channel.
Ripple is ranked in third place on the top cryptocurrencies by market-cap as it holds a $13.83 billion market cap.
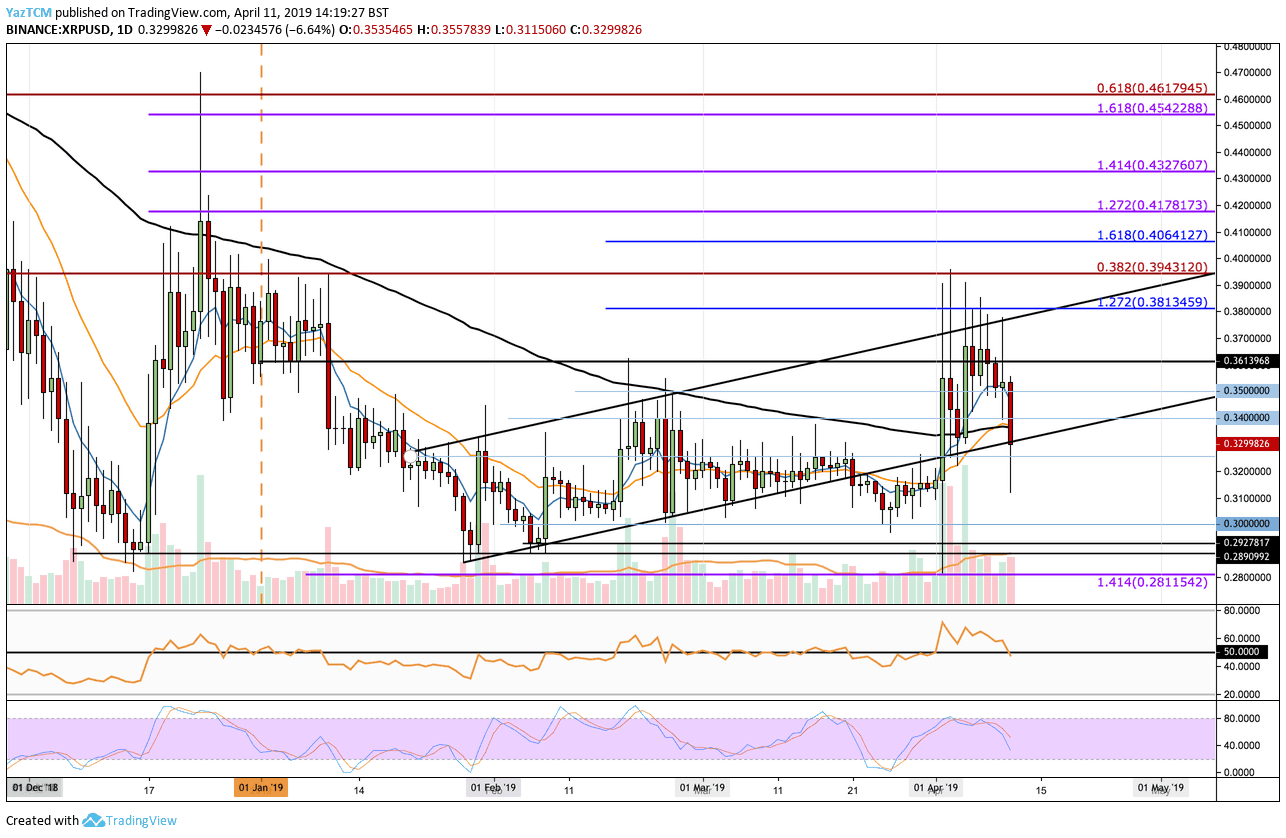
Looking at the XRP/USD 1-Day Chart:
- Against the dollar, we can see that XRP has now dropped into support at the lower boundary of the ascending price channel (as mentioned above). Over the past few days, XRP had been increasing but had failed to make movements above the price channel. The recent price drop has now caused XRP to fall beneath the 100-day moving average once again,
- From above: The nearest level of resistance now lies at the area of $0.34 – $0.35. Above $0.35, resistance is expected at $0.3613, before the upper boundary of the ascending price channel.
- From below: If the sellers push the market beneath the price channel, further support then lies at the $0.32 and $0.31 levels. This is then followed with more significant support level at $0.30. Further support is then expected at $0.289.
- The trading volume remains above average but has dropped from the high volume days seen at the start of the month.
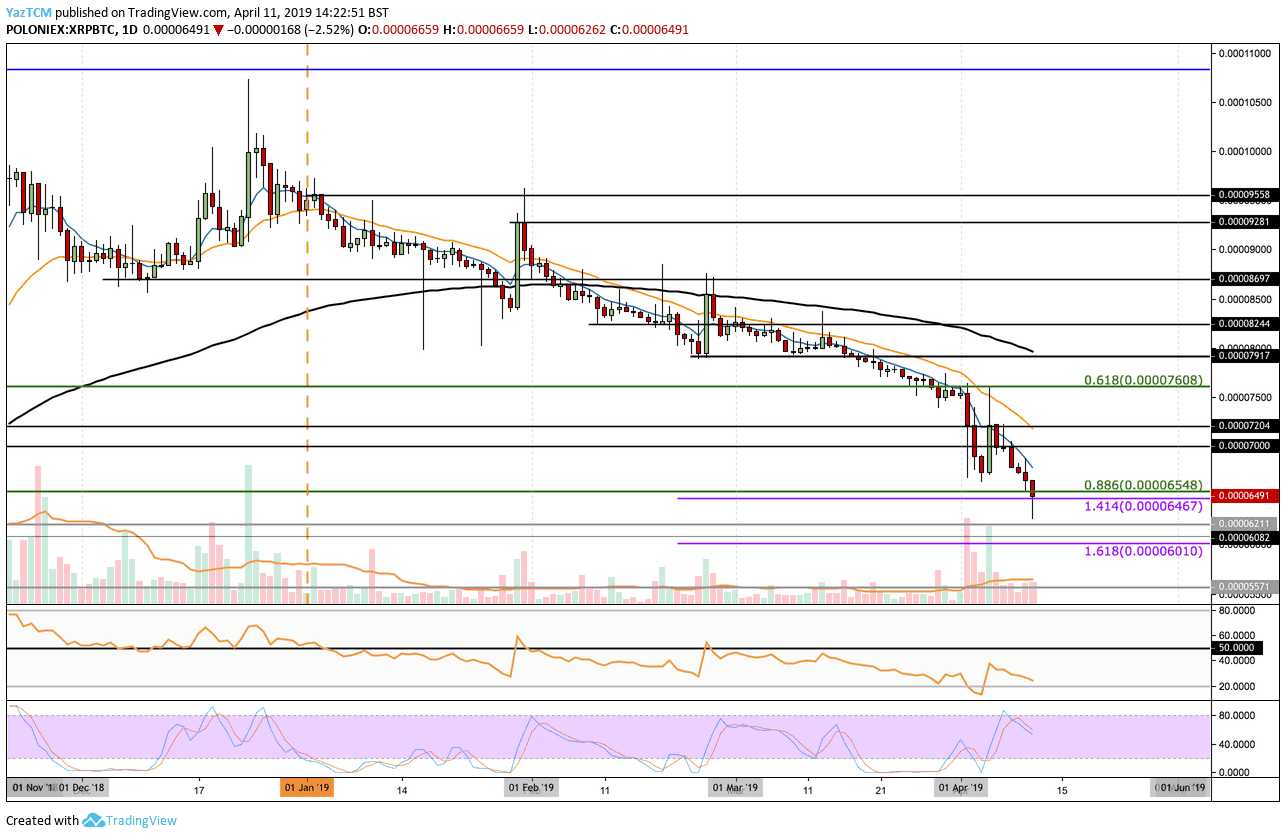
Looking at the XRP/BTC 1-Day Chart:
- Against Bitcoin, we can see that the market has also dropped into support around the 6500 SAT level where lies a .886 Fibonacci Retracement. XRP has been consistently bearish against Bitcoin during 2019, so far.
- From above: The nearest level of resistance now lies at 7000 SAT followed with more resistance at 7608 SAT. Further resistance is located at 8000 SAT, which also contains the 100-day moving average line.
- From below: The nearest level of support beneath 6500 SAT lies at 6211 SAT and 6000 SAT. The support at 6000 SAT is further bolstered by a short term downside 1.618 Fibonacci Extension level. Beneath 6000 SAT, more support is then located at 6670 SAT.
- Stochastic RSI has recently made a crossover in the bullish territory, which indicates that the selling pressure is mounting. The RSI has remained beneath the 50 level for the entire period of 2019 which is a bad sign for XRP.
- The trading volume is above average, but the increased sellers’ volume is pushing XRP down further down against BTC.
The post Ripple Price Analysis April 11: XRP Plummets Following Bitcoin’s Sentiment, Can The Bulls Maintain $0.33? appeared first on CryptoPotato.