Ripple Crashes 8.5% Weekly, Will $0.4 Hold? (XRP Price Analysis)
After Ripple’s sudden decline, the price fell below the 100-day moving average. However, it has now reached the critical support level of the 200-day moving average at $0.41, and the bears might just be getting started.
Technical Analysis
By Shayan
The Daily Chart
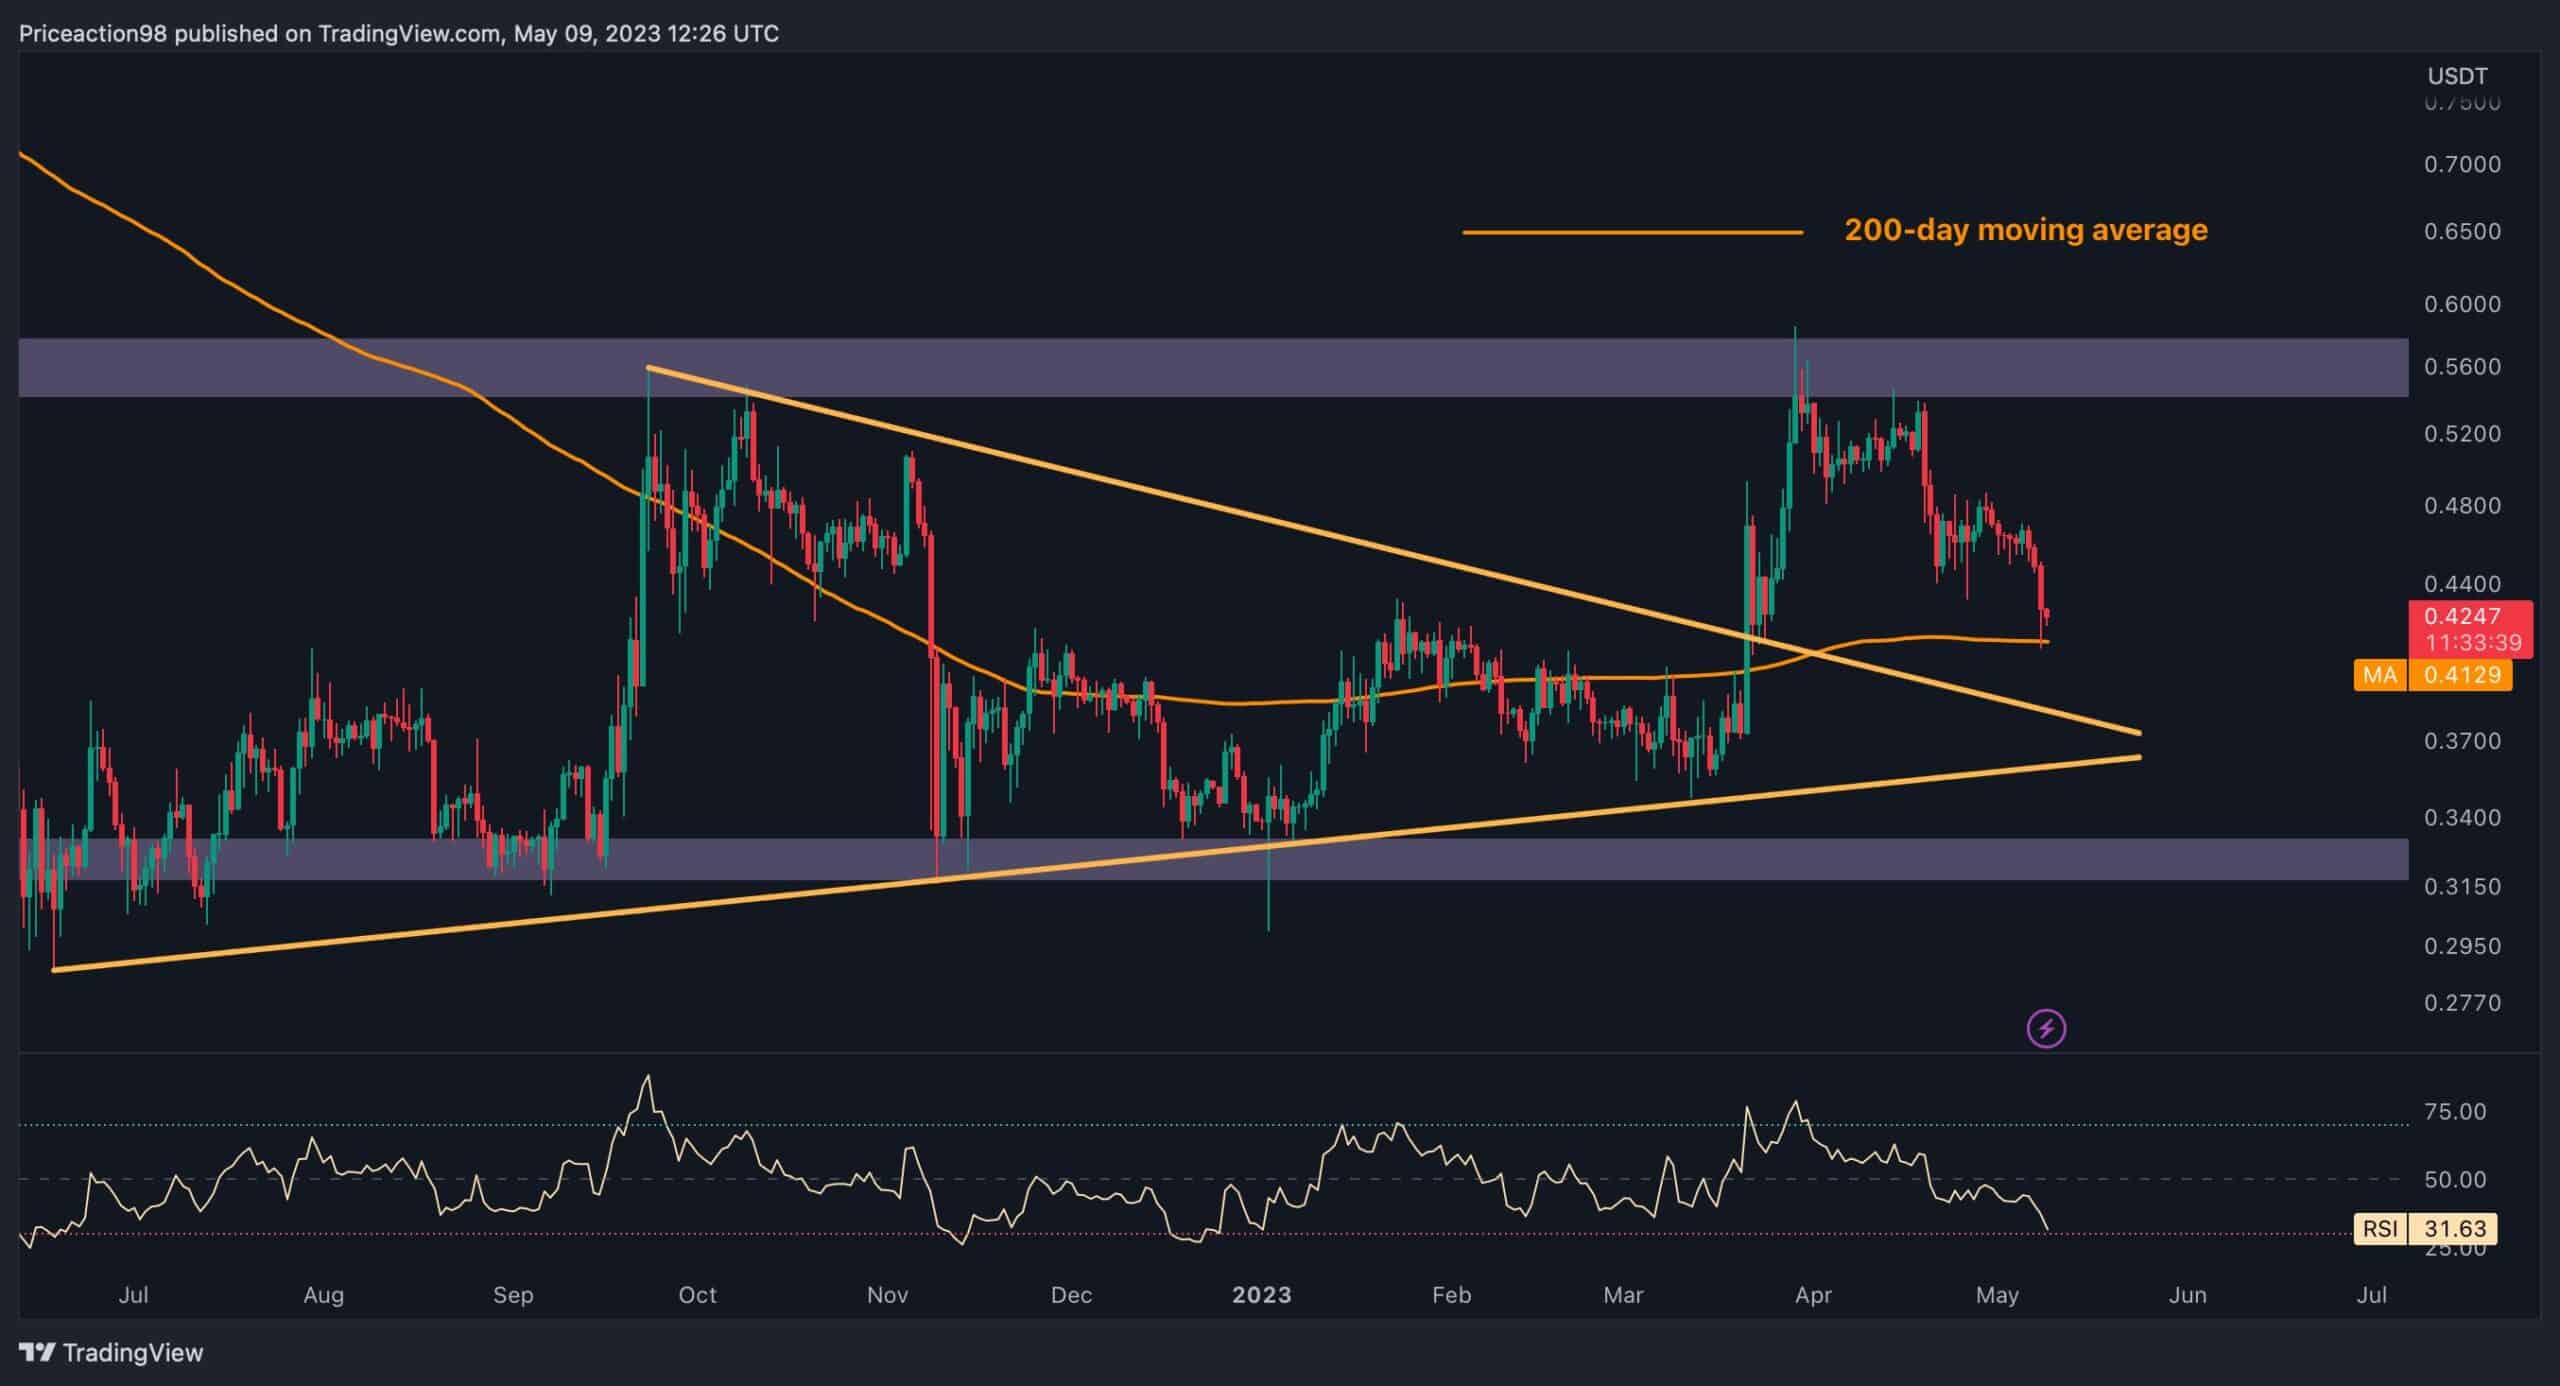
Following Ripple’s rejection from the $0.58 resistance level on the daily chart, the price experienced a massive decline, dropping below the 100-day moving average. However, the cryptocurrency has found substantial support at the 200-day moving average of $0.41.
The strength of this moving average suggests that the price may enter a consolidation phase. However, if the bears manage to push it below the 200-day moving average, this may trigger a cascade effect and bearish sentiment for Ripple’s long-term prospects.
The 4-Hour Chart
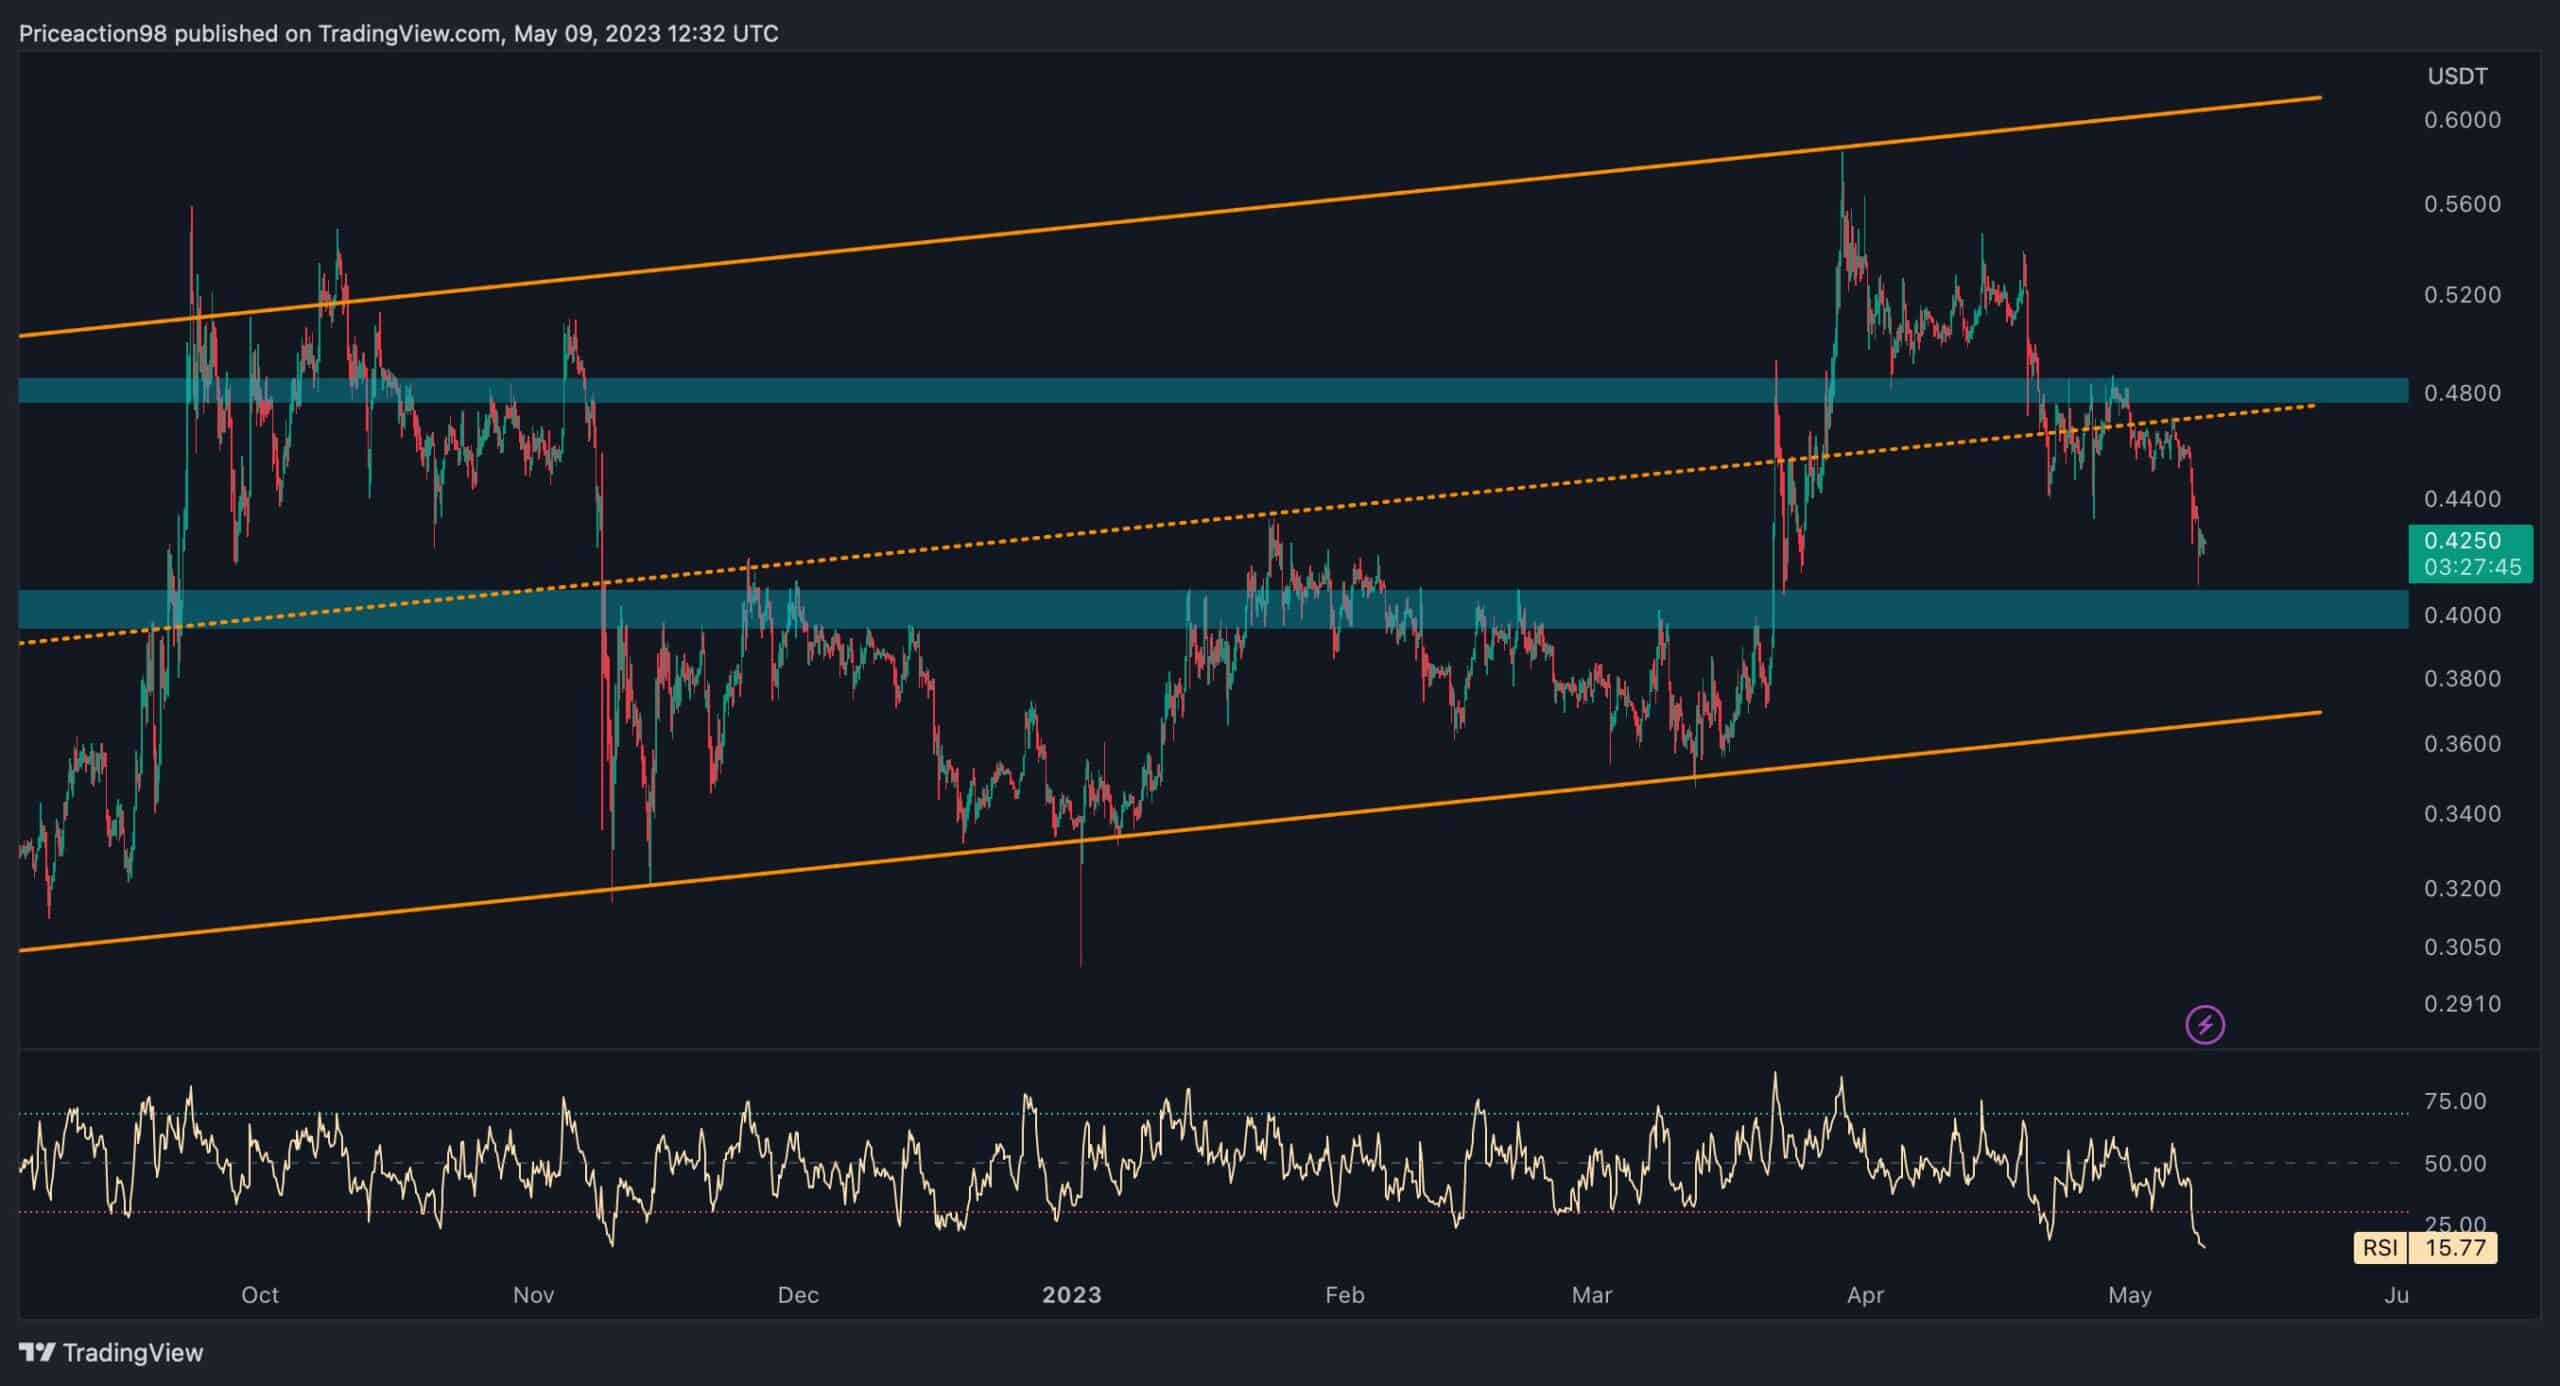
On the 4-hour chart, Ripple’s price has formed an ascending channel. The recent rejection caused it to drop below the minor support level of $0.48 and the channel’s mid-trend line. Currently, XRP faces two crucial support levels: the primary one of $0.4 and the channel’s lower trendline, approximately at $0.37.
In summary, based on the recent action, the price seems more likely to remain within the range of $0.4 and $0.48 until a breakout occurs.
The post Ripple Crashes 8.5% Weekly, Will $0.4 Hold? (XRP Price Analysis) appeared first on CryptoPotato.