Ripple Could Be Interesting Consolidating Around $0.3 – XRP Price Analysis March.11
The Ripple market continues to remain stagnant as price action persists in trading sideways. The XRP market has now only increased by a total of 2.32% over the past three months which indicates the poor performance by the coin, compared to other major altcoins: In comparison, Litecoin is up 133%, and Binance Coin is up 200% over the past 90 days.
Ripple remains ranked in the third position of the leading cryptos by market cap, as it currently holds a $12.88 billion market cap value. Overall, XRP has the potential to surge aggressively in case the $0.32 and $0.34 resistance area could get breached following a decent amount of volume.
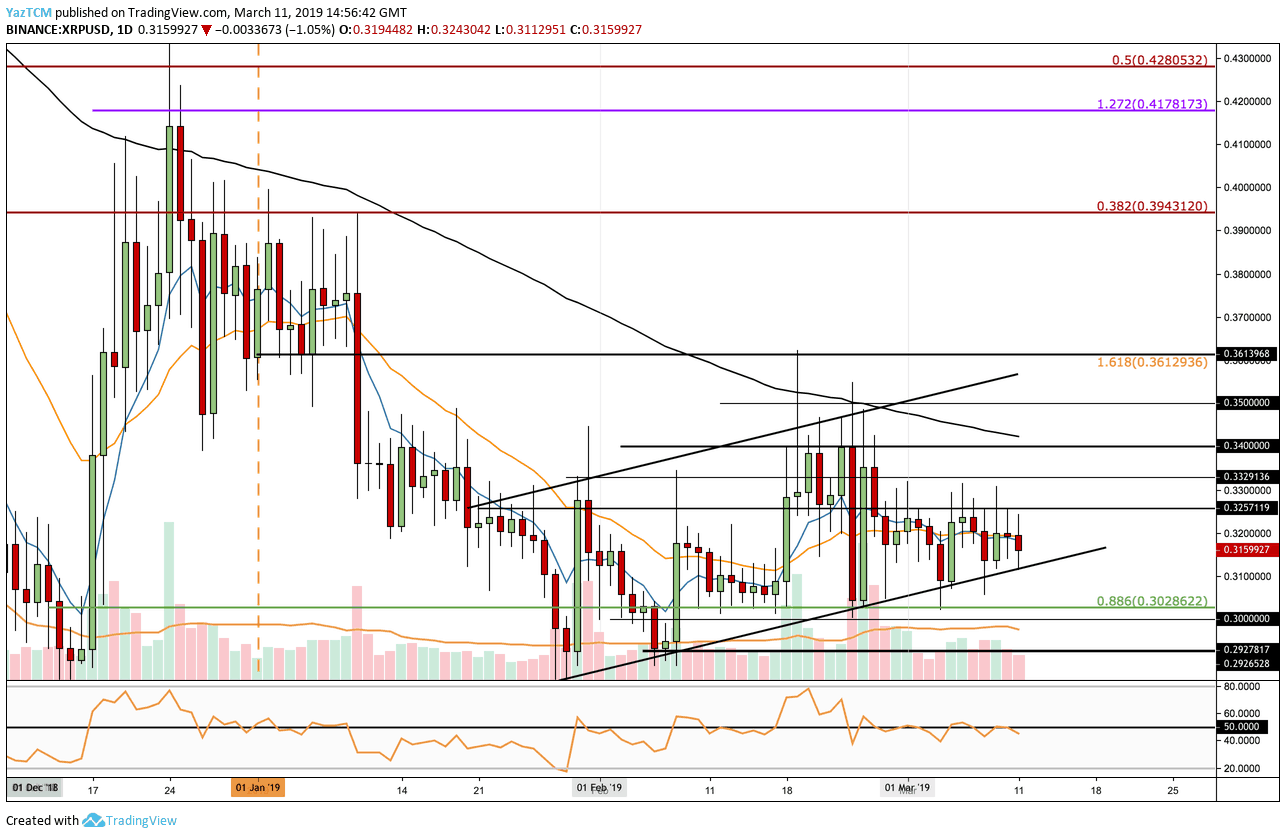
Looking at the XRP/USD 1-Day Chart:
- Since our last Ripple analysis, we can see that XRP had failed to break above the resistance at the $0.3257 level and continued to fall into support at the lower boundary of the price channel that Ripple has been trading inside since late January 2019.
- From above: The nearest level of resistance remains $0.3257.Further resistance lies at $0.3329 and the mentioned $0.34. Above $0.34 lies the 100-days moving average, before the $0.35 level. If the buyers can break above $0.35 higher resistance – the next level lies at $0.3613 and $0.38.
- From below: The closest support lies at the lower boundary of the ascending price channel. If the market breaks below, support then lies at the $0.3028 and $0.30 levels. Below $0.30, we can expect support at $0.2927 and $0.2858.
- The RSI continues to trade around the 50 level as the market decides where to head toward next.
- The trading volume is around not significant.
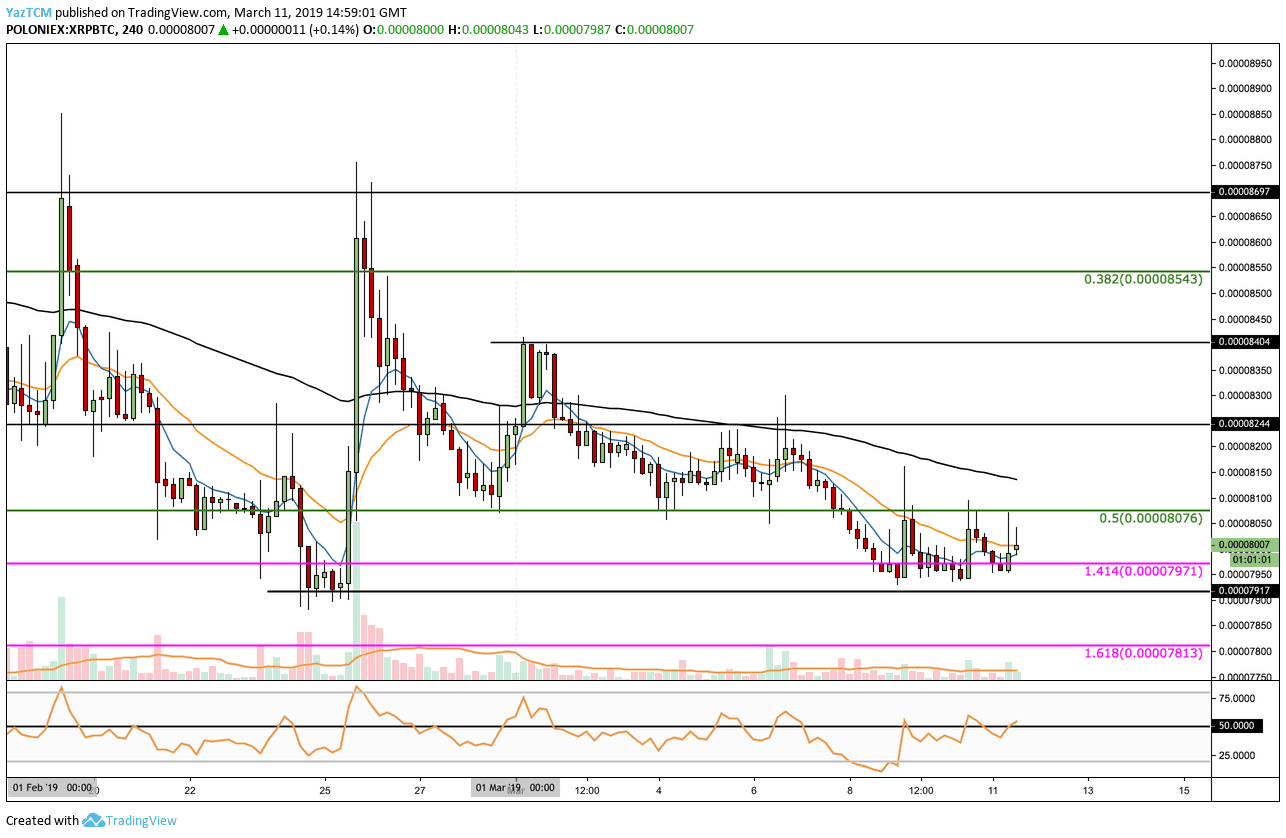
Looking at the XRP/BTC 4-Hour Chart:
- Ripple had struggled to break above the resistance around 8076 SAT and continued to decline into support beneath the 7971 SAT area, at the downside 1.414 Fibonacci Extension level towards the 7940 SAT level. XRP has since rebounded from that support as it now trades around 8000 SAT.
- From above: The nearest resistance lies at the 8076 SAT level at the .5 Fibonacci Retracement level. Above this, higher resistance lies at 8244 SAT and 8404 SAT. This is then followed by 8543 SAT resistance, where lies the .382 Fibonacci Retracement level and further above lies the 8697 – 8700 SAT resistance.
- From below: The nearest support is at the current level of 8000 SAT followed by the 7971 SAT. Below we can expect 7915 SAT, and 7813 SAT support, where lies the downside 1.414 Fibonacci Extension level.
- The RSI has recovered from bearish territory beneath 50 and is now attempting to travel higher above the 50 level.
The post Ripple Could Be Interesting Consolidating Around $0.3 – XRP Price Analysis March.11 appeared first on CryptoPotato.