Research Firm Charts Unspent BTC and Calls a Market Bottom in Q1 2019

“How many unspent bitcoins exist?”
“How many bitcoins have been lost?”
“How many bitcoins are left sitting in wallets, and how does this affect price?”
If any (or all) of these questions have ever popped into your head, you’re in good company: They’ve crossed the minds of analysts at Delphi Digital, the self-named “research & consulting boutique specializing in the digital asset market.”
The firm just released research on the current state of the bitcoin market, and they believe they’ve forecasted a potential bottom for its declining prices (FYI, they think it’s coming sometime in Q1 of 2019, but more on that later). Delphi Digital gave us an early peek at the report before announcing it on social media January 10.
This report isn’t your typical, shot-in-the-dark price signal from an old bull, Twitter trader or crypto entrepreneur. They didn’t use the usual magic tricks of technical analysis or rehash arguments of fundamental value. They’re making their call by referencing unspent transaction output data (UTXO).
Methods and Findings
The report, titled “Bitcoin Holder Analysis Through Cycles,” builds on analysis Delphi Digital conducted for an earlier report entitled “The State of Bitcoin.” Namely, it creates a price forecast by viewing selling pressure through the lens of UTXO.
Looking at UTXO data, Delphi Digital was able to pinpoint accumulation and selling patterns based on when unspent bitcoin either lay dormant or was moved to be sold. In its report, the firm claims that there “have been consistent trends in UTXO age distribution and how that distribution relates to time and price.”
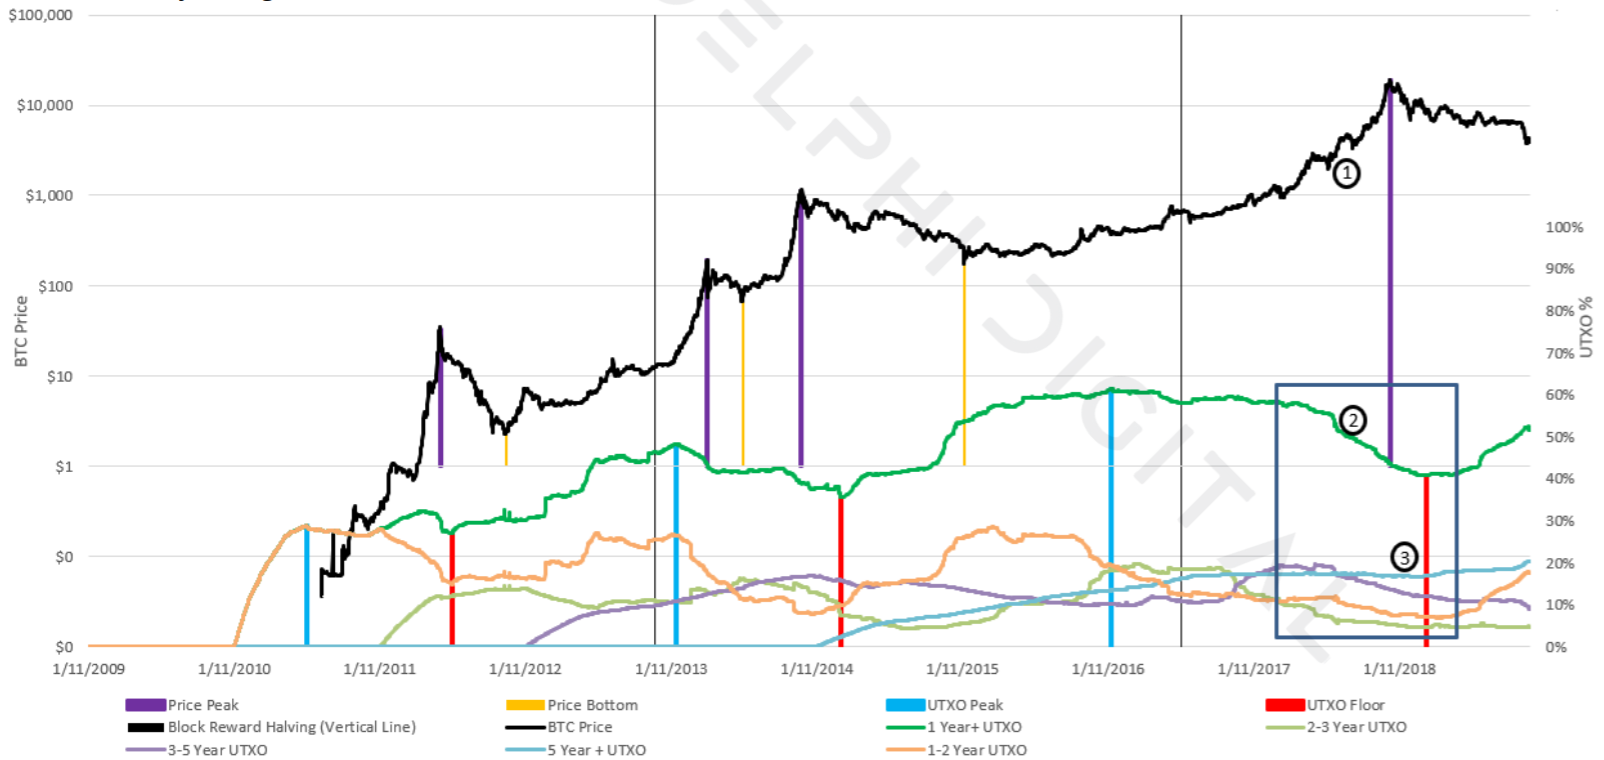
Delphi Digital’s report comes with a handy graph to illustrate these trends. Positioned under a bitcoin price chart, the firm tracked the percentage of unspent bitcoins in ≤ 3 month, 3–6 month, 6–12 month, 1+ year, 1–2 year, 2–3 year, 3–5 year and 5+ periods in a series of charts. They cover every major boom and bust in their analysis, with data dating back to the beginning of the network (though there wasn’t much going on in the first year).

In short, the analysis finds a substantial correlation between a rise in the total number of coins that haven’t been touched in 1+ year(s) and a drop in the number of 1+ year UTXO as prices fall.
This isn’t too surprising. As the long-term holders and early adopters of each cycle see a rapid appreciation of their investment, they dump. And, as the report points out, this dumping creates a generation of bag holders on the other end of the transaction. New money comes at the crest of a cycle, investors buy the top and those late to the party are left with overpriced party favors.
The bulk of the report looks at the time bands to diagnose the most recent market cycle. Breaking down its 1+ year band into 1–2 year, 2–3 year, 3–5 year and 5+ periods, the firm’s data indicates that the UTXO for the 1+ year time band found a floor midway into 2018 and has reversed to an upward trend. Delphi Digital concluded that this likely indicates that long-term holding (3–5+) selling pressure is close to exhausted, and thus projects that the market will hit a bottom some time in Q1 of 2019.
Time bands can only change if a) coins are spent and these coins then regress to the ≤ 3 month band or b) if coins remain unspent and graduate to an older band. Given this logic, Delphi used the 5+ year UTXO as a variable to gauge selling pressure from coins in the 3–5 year band, since most of the coins in the 5+ band are lost (Chainanalysis finds that some 2.78–3.79 million could be lost, roughly 1 million of which are probably Satoshi’s).
While the 5+ year band has remained static during 2018’s bear, the chart shows a clear reduction in the 3–5 year band and a rise in the 1+ year band, meaning that 2–5 year coins are being spent, not graduating to the 5+ range.
“We can safely assume the primary source of selling came from coin owners who’ve been holding for 3–5 years,” Delphi Digital hypothesizes in the report.
“Within the analysis, we are able to establish that selling pressure from long-term holders is significantly tapped, and accumulation has begun. Using the timing of previous price bottoms relative to different bitcoin accumulation points, we can use current UTXO dynamics to forecast a rough date for a price bottom,” the firm said in correspondence with Bitcoin Magazine.
Forecast
Delphi Digital’s findings will likely bring some relief to hodlers who have weathered the 2018 bear market.
It also offers an optimistic glimpse at what the trajectory of the next cycle might be.
Using some brain-bending statistical gymnastics, the firm “compared the amplitude of the 6–12m line to see what portion it made up of the 1+ year bottom to top amplitude” (i.e., looking at the percentage (amplitude) of the 6–12 month band compared to the lowest and highest point in the 1+ year band for a cycle).

Sizing up the 6–12 month band and the 1+ year band for this cycle against previous ones, the Delphi Digital projects that the next cycle’s peak will come around April 17, 2020.
Now don’t go take out a second mortgage on your house/car/vintage doll collection. Delphi Digital admits that its data is limited, but it also believes that the consistency of its data (that the peak of market cycles correspond with the a roughly 63–68 percent peak in the 1+ year UTXO time band). Still, the firm cautions that it is “difficult to be confident in a forecast for a date this far out.”
“The purpose of this analysis is to provide insight on bitcoin holder patterns to improve our educated guess on the timing of the price bottom. As we say within the report, we don’t believe this analysis should function as an indicator on its own — but rather it should be used in combination with other relevant data to make the most informed decision possible,” Delphi Digital told Bitcoin Magazine.
Plenty of industry advancements and events could disrupt the projected cycle, Delphi Digital continued to explain. Most notably, it expects the maturation of the Lightning Network and general adoption to tame volatility. Moreover, it also anticipates that the next halvening (~May 2020) will also dampen selling pressure.
Delphi Digital will continue to release reports such as this one throughout the year.
Trading and investing in digital assets like bitcoin is highly speculative and comes with many risks. This article is for informational purposes and should not be considered investment advice or an endorsement of any product. Statements and financial information on Bitcoin Magazine and BTC Media related sites do not necessarily reflect the opinion of BTC Media and should not be construed as an endorsement or recommendation to buy, sell or hold. Past performance is not necessarily indicative of future results.
This article originally appeared on Bitcoin Magazine.


