Public Miners Start Selling Bitcoin Treasuries
As June monthly production updates roll out over the next week, Core Scientific and Bitfarms have both sold nearly 50% or more of their bitcoin treasuries.

The below is an excerpt from a recent edition of Bitcoin Magazine Pro, Bitcoin Magazine’s premium markets newsletter. To be among the first to receive these insights and other on-chain bitcoin market analysis straight to your inbox, subscribe now.
Core Scientific Sells 7,202 BTC
On July 5, 2022, Core Scientific, the world’s third-largest publicly traded bitcoin miner by market cap ($525.52 million) announced in its June monthly update the sale of 78.6% of its bitcoin holdings.
“During the month of June, the Company sold 7,202 bitcoins at an average price of approximately $23,000 per bitcoin for total proceeds of approximately $167 million. As of June 30, 2022, the Company held 1,959 bitcoins and approximately $132 million in cash on its balance sheet.
“Proceeds from bitcoin sales in June were primarily used for payments for ASIC servers, capital investments in additional data center capacity and scheduled repayment of debt. The Company will continue to sell self-mined bitcoins to pay operating expenses, fund growth, retire debt and maintain liquidity.”
Last week, in our latest mining issue, we covered some of the dynamics of the bitcoin mining cycle, and the hash price bull and bear market.
Given that hash rate is only 5.43% below its all-time high reading, some more pressure on mining operations looks to be on the horizon. Previous bear market miner capitulation periods saw hash rate drawdowns of over 25% from previous highs, with 52.22% after the China miner ban being the largest drawdown in the history of bitcoin.
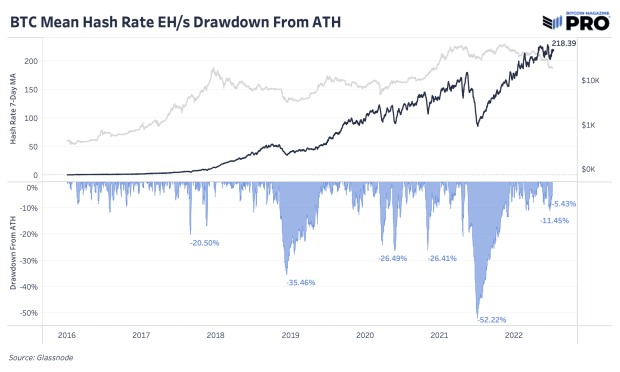
While the relative growth of hash rate has diminished greatly in recent years, the absolute growth of the industry has been enormous, particularly in the publicly traded sector.
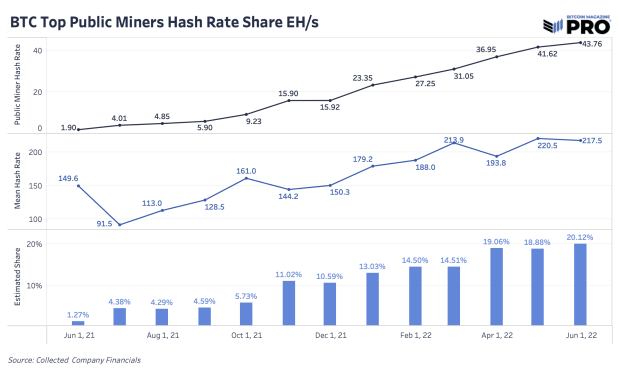
The mining industry’s recent rise and synergy with public markets over the past two years gave it plenty of access to debt financing that was unavailable in previous cycles. This allowed for miners to boost equity market valuations by borrowing against their holdings to finance operations and additional capital expenditure.
This dynamic has led miner operations to be underwater on months of bitcoin mining revenue while still having to finance power agreements and outstanding debt. While this is a broad over-generationalization of the industry, it is the reason why the equity of said miners relative to bitcoin have performed so poorly.
What Sparks A Recovery In Public Miners?
When investing in bitcoin miner companies or infrastructure, you are investing for the next hash price bull market — the “gold rush” phase of the bitcoin market cycle. Shown below is hash price (in logarithmic scale) with the bottom pane showing its rise from previous all-time lows.
As a reminder, hash price is defined as daily miner revenue divided by hash rate.
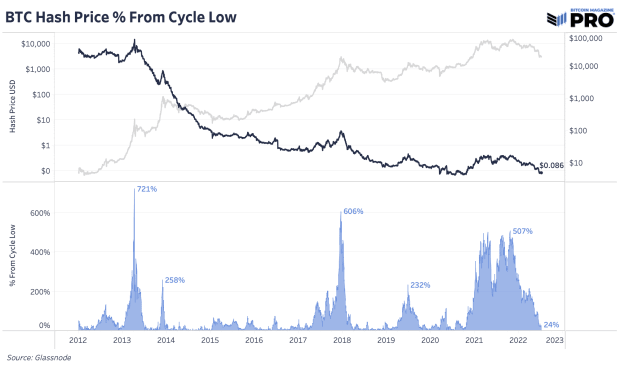
Given the vicious competitive nature of mining, and hash rates recent bounce back to 218 EH/s, more headwinds are on the horizon for the sector — which could place even more pressure on the BTC/USD exchange rate, further reenforcing the squeeze on margins in the mining sector.
In tomorrow’s Bitcoin Magazine Pro Issue, we will cover the latest moves in the macroeconomic landscape regarding interest rates, commodities and foreign exchange markets. Subscribe to access the full Bitcoin Magazine Pro newsletter.


