Polygon Price Analysis: MATIC Plunges 8%, Approaching Key Support at $2
Key Support levels: $2, $1.8
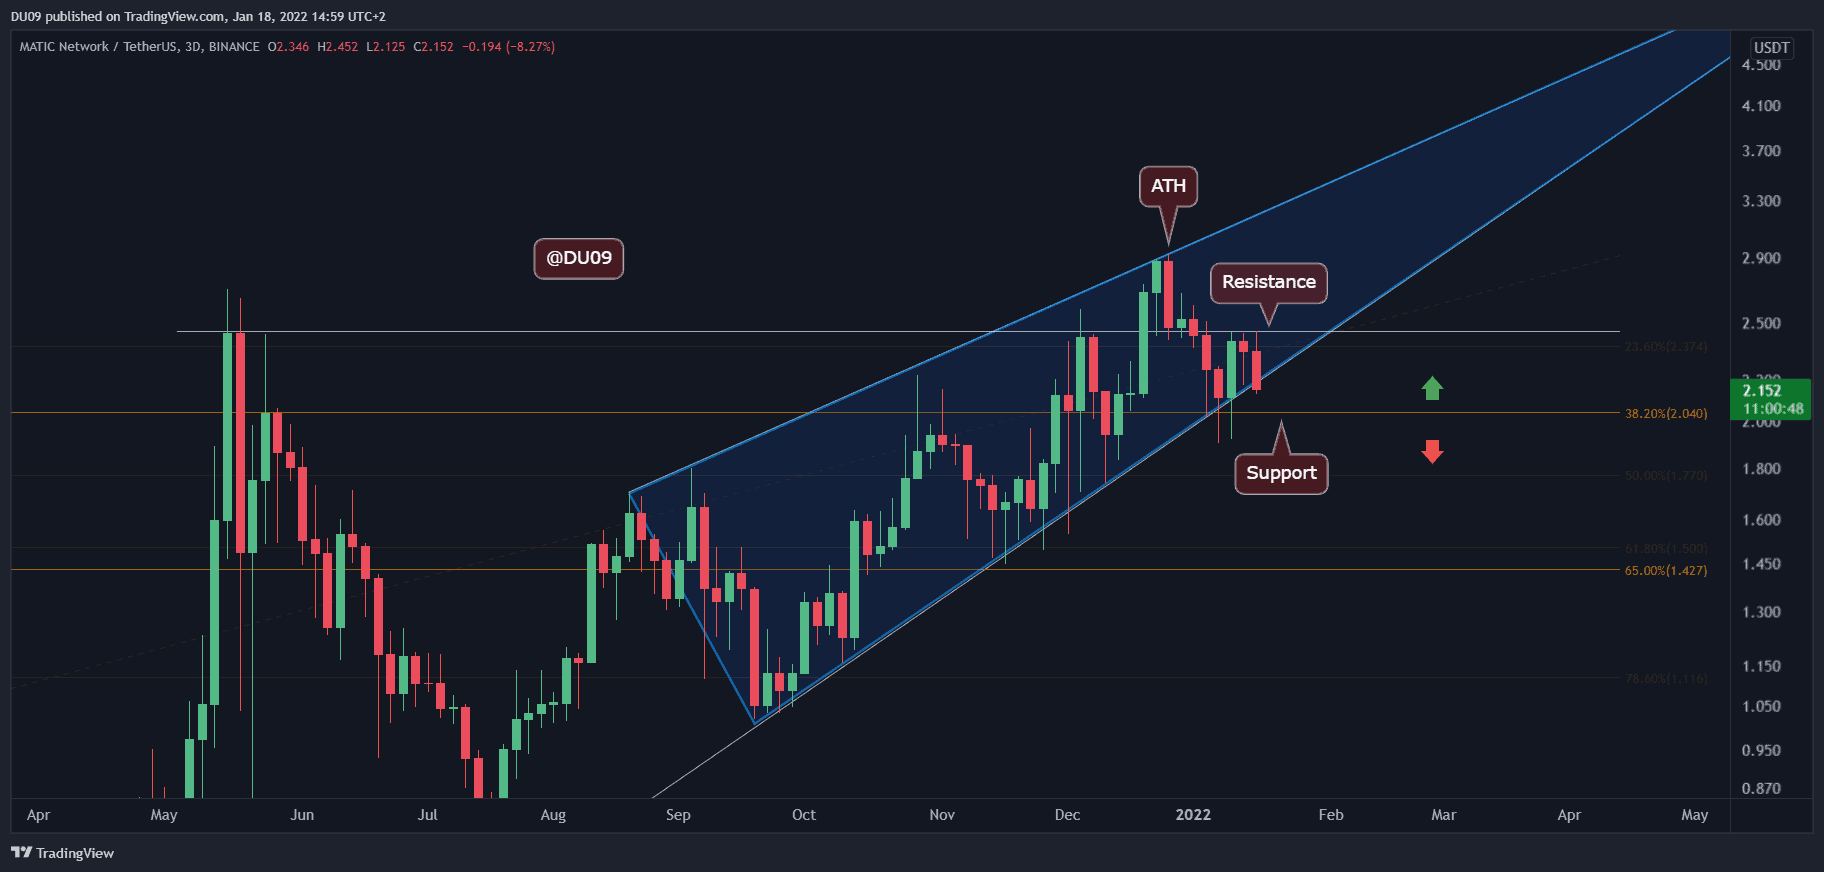
Key Resistance levels: $2.4, $2.9 (ATH)
After a great performance where the price hit $2.9, MATIC lost momentum and is now correcting towards the key support at $2. The level at $2.4 was confirmed as resistance, and the price has formed lower highs since then.
On the way up, MATIC has formed a large bearish wedge (represented in blue on the first chart) and now the price appears to be on the decline. The cryptocurrency is likely to enter into a correction and longer consolidation.
Technical Indicators
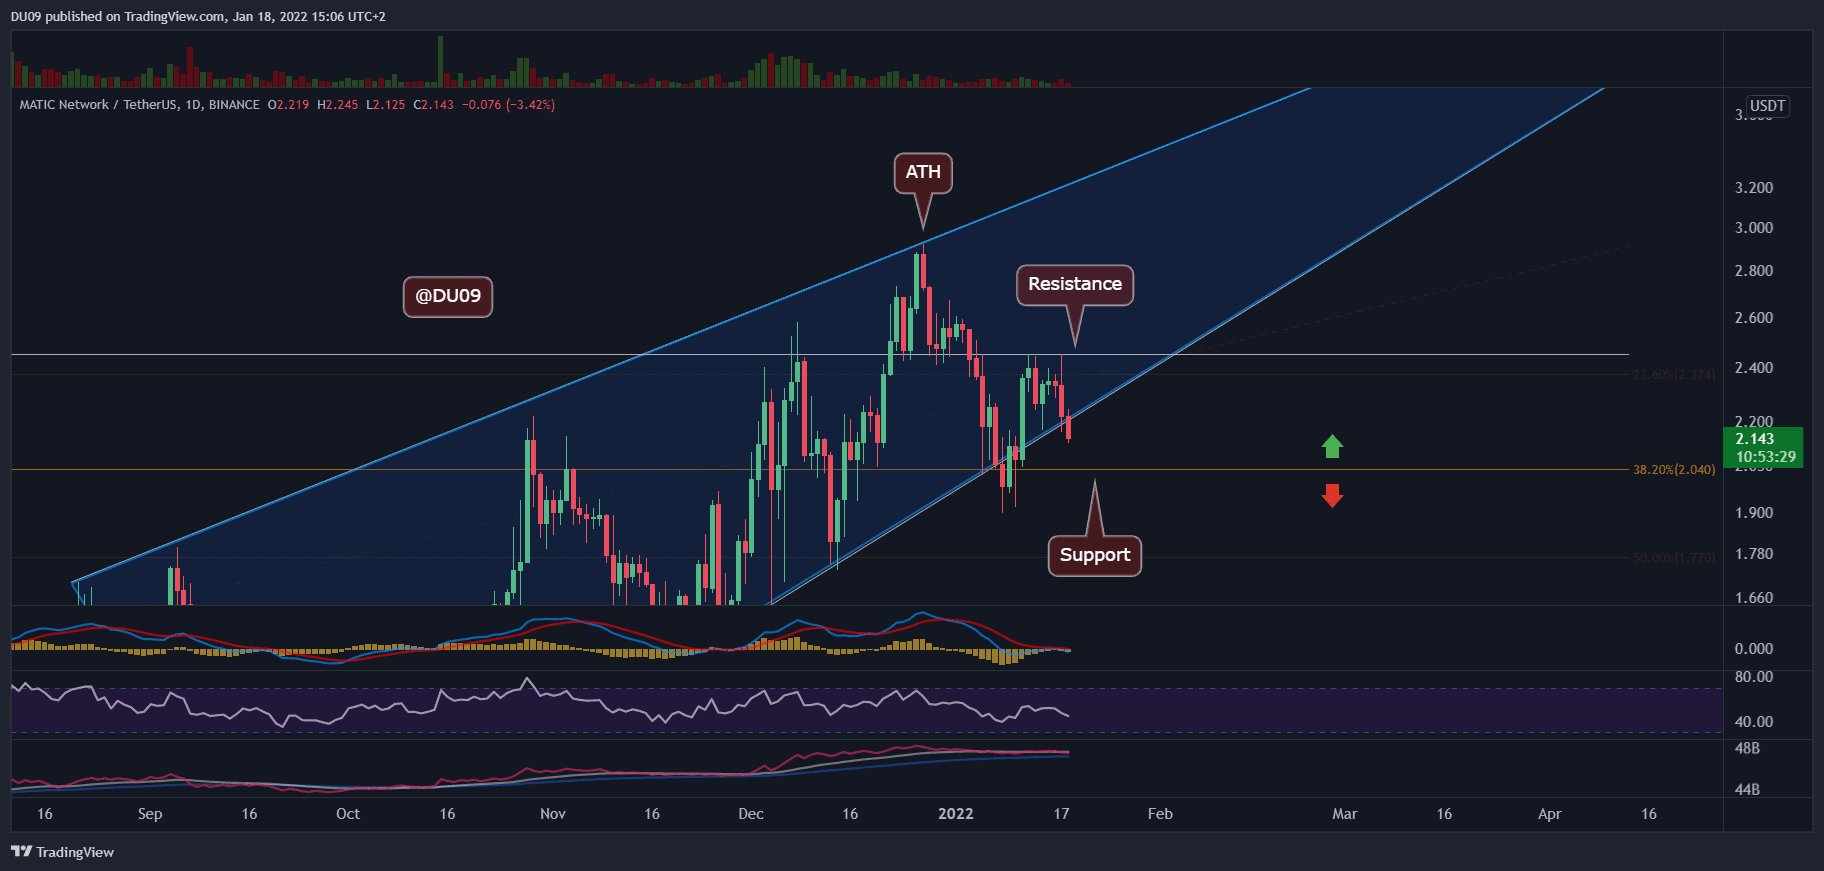
Trading Volume: Somewhat expectedly, the volume decreased after the all-time high, and MATIC entered into a correction on low volume.
RSI: The daily RSI is making lower highs which are typical of a bearish trend. This is likely to continue as MATIC searches for new support.
MACD: The daily MACD turned bearish after the price hit $2.9, and since then, the trend has been bearish. So far, MATIC failed to turn around, and the correction continues. Until the MACD completes a bullish cross, it is unlikely for the price to make new highs.
Bias
The bias for MATIC is bearish.
Short-Term Price Prediction for MATIC
MATIC’s stellar performance in December 2021 was followed by a significant correction in January. The price decreased by over 30% before recovering. The trend remains bearish, and MATIC will likely test the $2 support level again. If that doesn’t hold bears in check, then MATIC is likely to fall lower.