Polygon Price Analysis: MATIC Eyes $2 as Major Move Appears Imminent
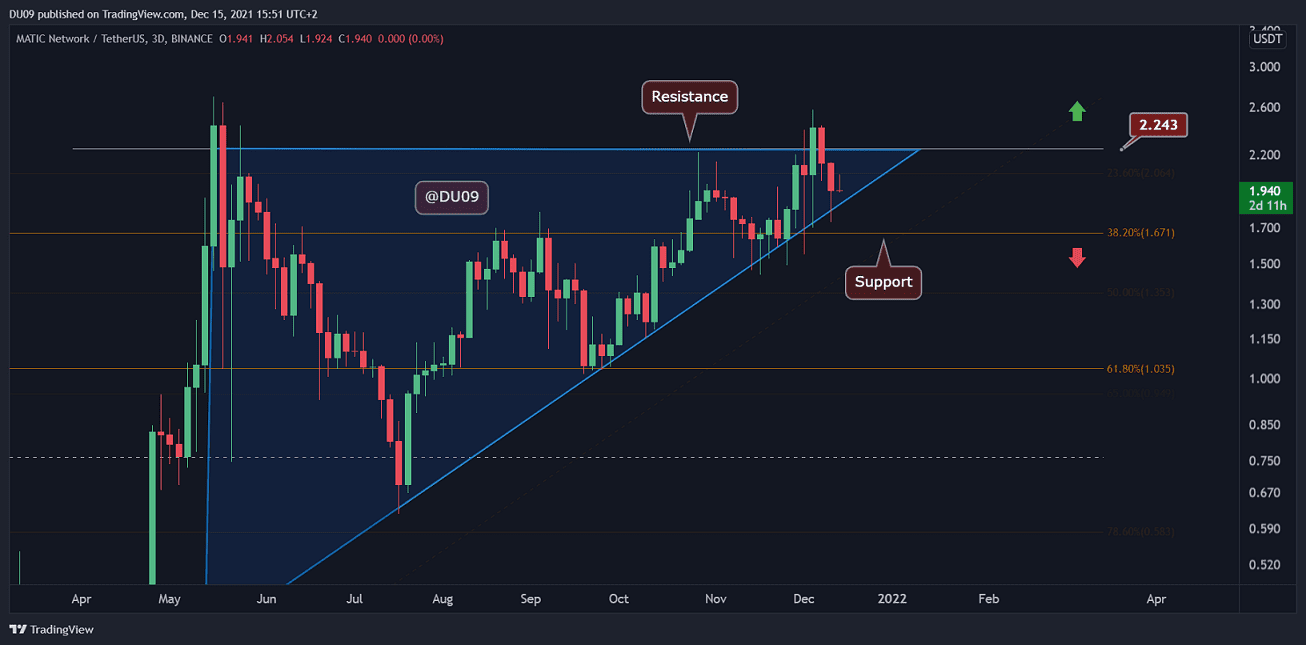
Key Support levels: $1.7, $1
Key Resistance levels: $2.2, $2.7 (ATH)
MATIC’s uptrend has formed a steep ascending triangle (in blue), and the price has hit the resistance at $2.2 before being pushed back down. The price is currently found in the apex of this formation, and there is little room left for MATIC to move. Therefore a breakout can be expected at any moment. Should MATIC fall, the price should find good support at $1.7 and $1.
Considering the current market conditions, it would be mindful to consider that a continuation might fail, despite the strong performance. This is because the weakness in ETH and BTC can pull MATIC down despite showing tremendous strength during the December 4th crash.

Technical Indicators
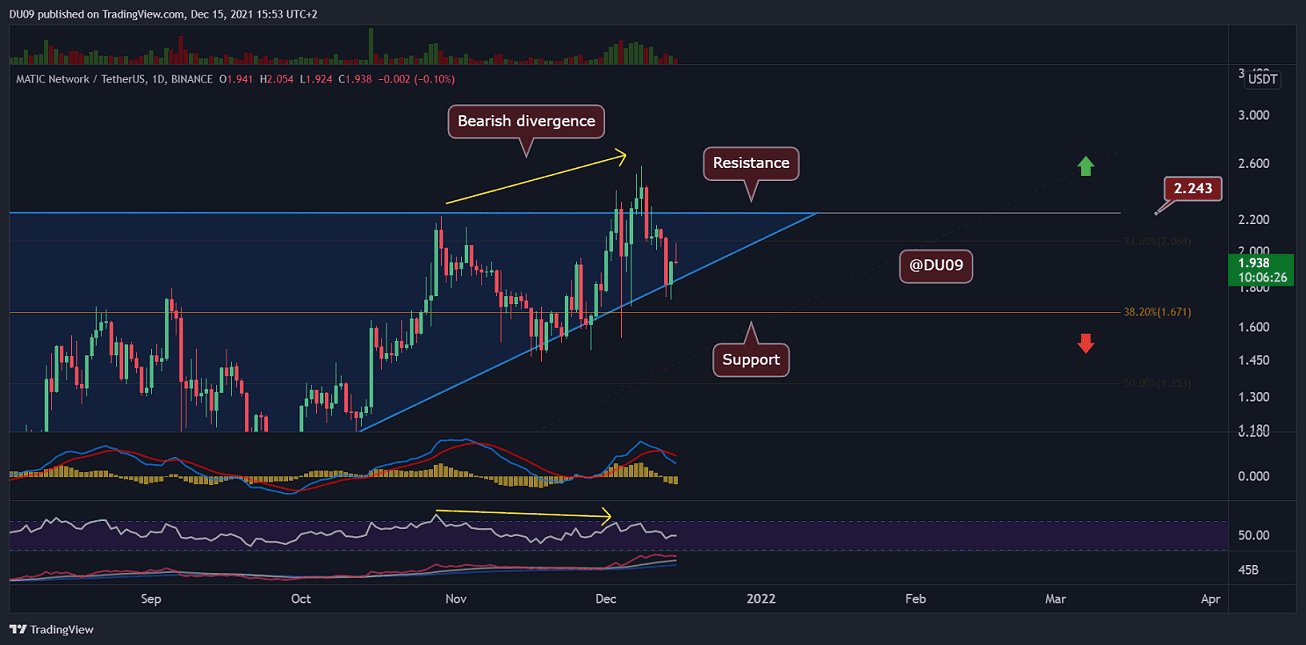
Trading Volume: The volume during the uptrend was strong, but it’s now fading. A break below the ascending triangle may embolden the bears to push MATIC towards a correction.
RSI: The daily RSI has made a large bearish divergence with a lower high despite price pushing above $2.2 for a brief period. This is a sign that buyers need to be careful, as a correction may follow if this divergence is confirmed.
MACD: The daily MACD is bearish, and MATIC is unlikely to rally until the moving averages return on the uptrend.

Bias
The bias for MATIC is neutral. A break from this formation will change the bias to bullish or bearish. Right now, the bearish case seems to have more weight to it, considering the indicators.
Short-Term Price Prediction for MATIC
MATIC had a fantastic rally and show of strength in December, with prices moving higher while most of the crypto market entered a deep correction. It would be impressive if it can continue to keep this momentum, but given the overall crypto sentiment, it seems less likely.


