Polygon Price Analysis: MATIC Drops to $1.6 as Correction Deepens
Key Support levels: $1.6, $1.4
Key Resistance levels: $1.8, $2
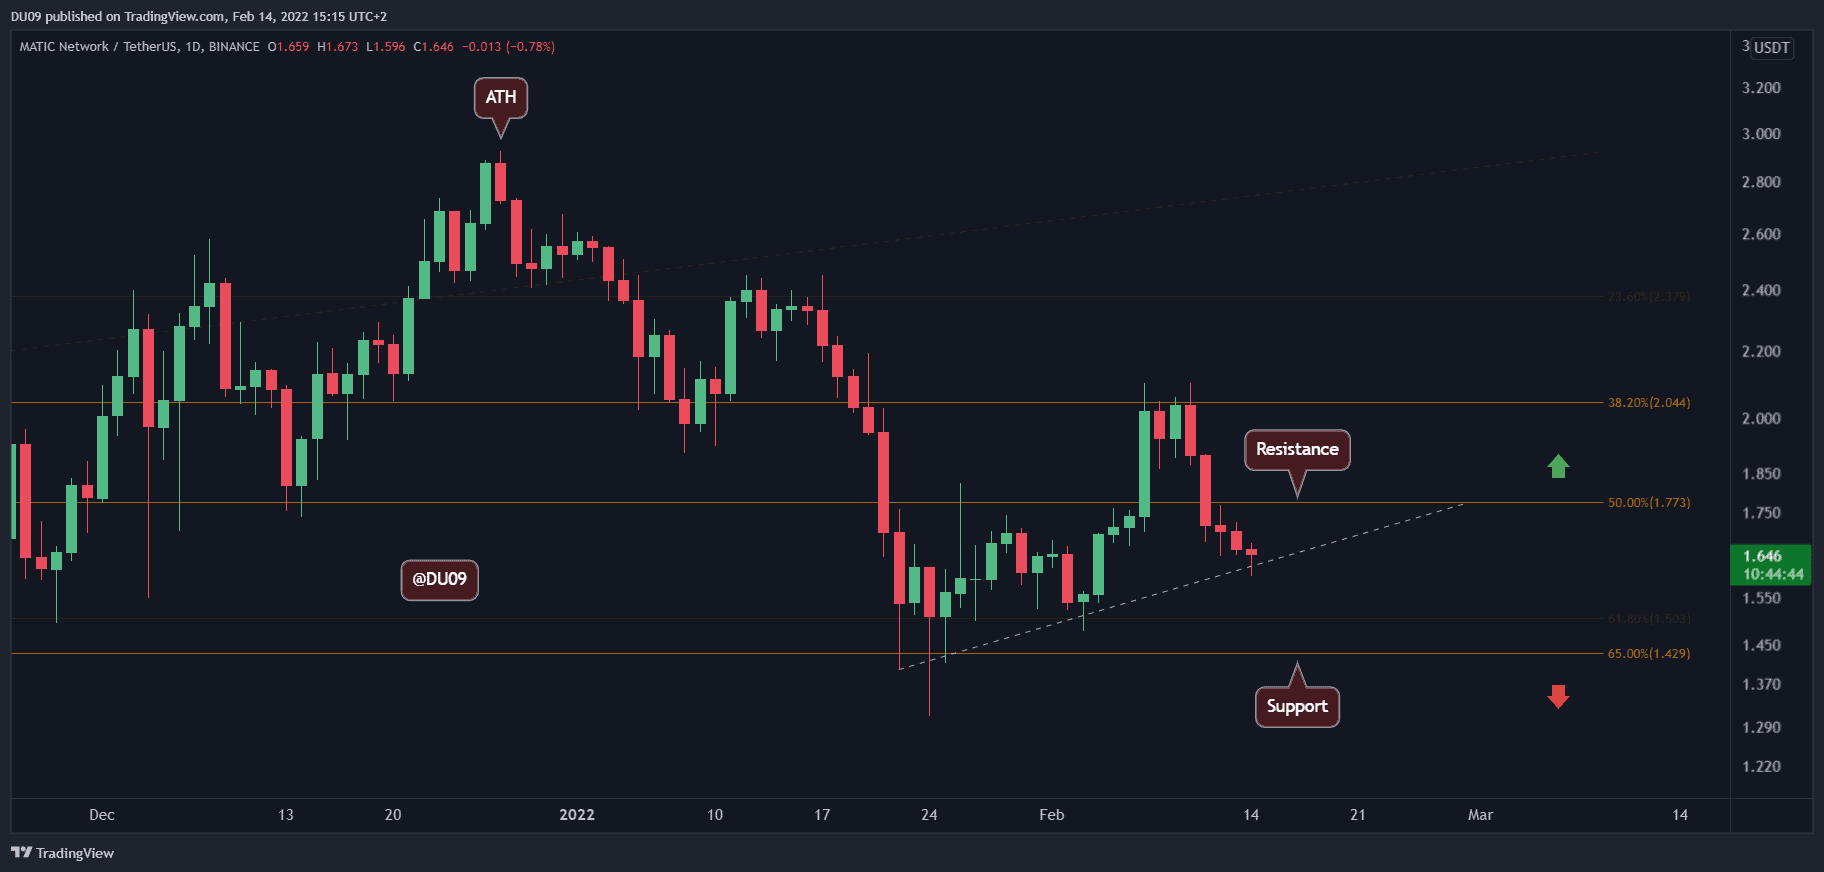
MATIC’s price saw a sharp drop after hitting the $2 resistance and fell all the way to $1.6 at the time of this post. If the correction continues, then the cryptocurrency can rely on good support at $1.4. The current resistance sits at $1.8.
Technical Indicators
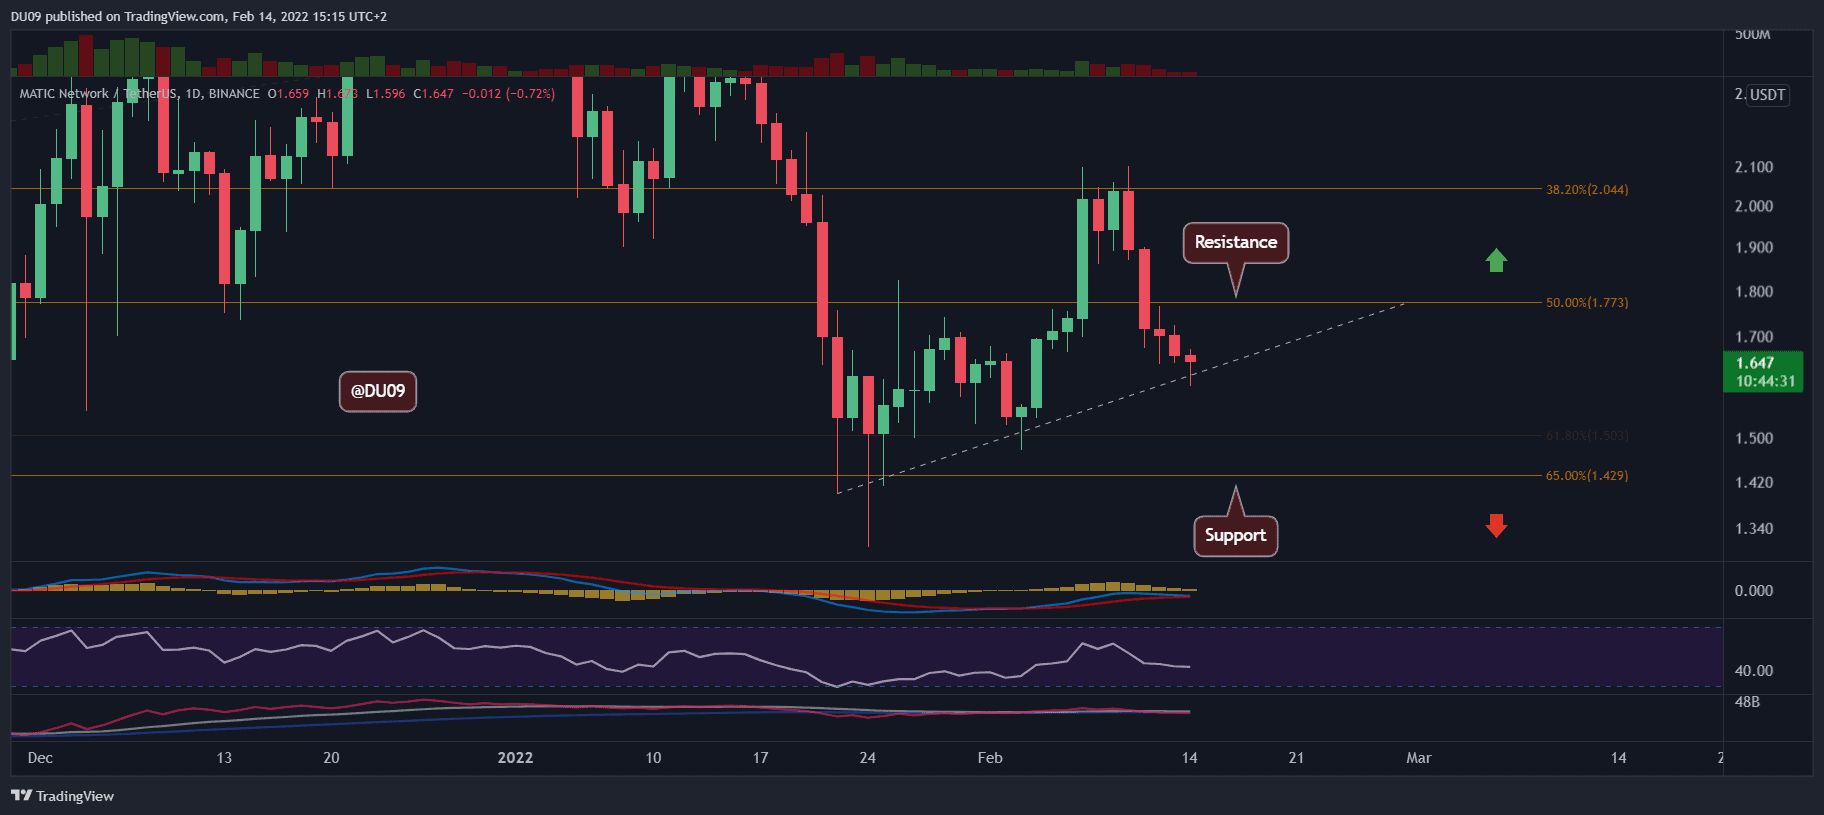
Trading Volume: In the past five days, the volume has closed in red, singling a strong pullback after buyers failed to push MATIC above $2. Bulls do not seem to be very interested in MATIC right now, and they might be waiting for lower levels to participate.
RSI: The daily RSI is falling in line with the price. The question is if MATIC can stop the correction here or if the price will continue to fall to $1.4. Either way, it is important for the RSI to not make a lower low.
MACD: The daily MACD is quickly approaching a bearish cross. Therefore, it is important for buyers to defend the price at $1.6 otherwise, this correction will likely continue for some time.
Bias
The current bias for MATIC is bearish. There is very little buy pressure or interest from buyers at this time.
Short-Term Price Prediction for MATIC
MATIC has good support at $1.4 and will likely test this level again if bulls do not step up their game. The price action remains bearish and the indicators do not give a lot of hope right now for a reversal.