Polkadot Price Analysis: Where Is DOT Heading Next After Losing the $6 Level?
Polkadot’s price has shown a slight reversal, accompanied by a minor bullish retracement toward the previously breached lower trendline of the triangle pattern.
However, if the pullback to this broken trendline is successful, the continuation of the bearish trend is likely.
Technical Analysis
By Shayan
The Daily Chart
A close look at Polkadot’s daily chart reveals a slight reversal in price, followed by a minor bullish retracement toward the previously breached lower trendline of a multi-month triangle. This uptick is attributed to increased demand near the $5.4 mark and diminishing bearish momentum. The asset is now aiming to complete a pullback to this broken trendline.
If the pullback is successful and bearish momentum resumes, Polkadot is likely to continue its initial bearish trend, with the next target around the crucial $5 support range. However, in the broader context, the price remains confined within a critical range, bounded by the $6 resistance and the $5 support, awaiting a valid breakout to determine the next major move.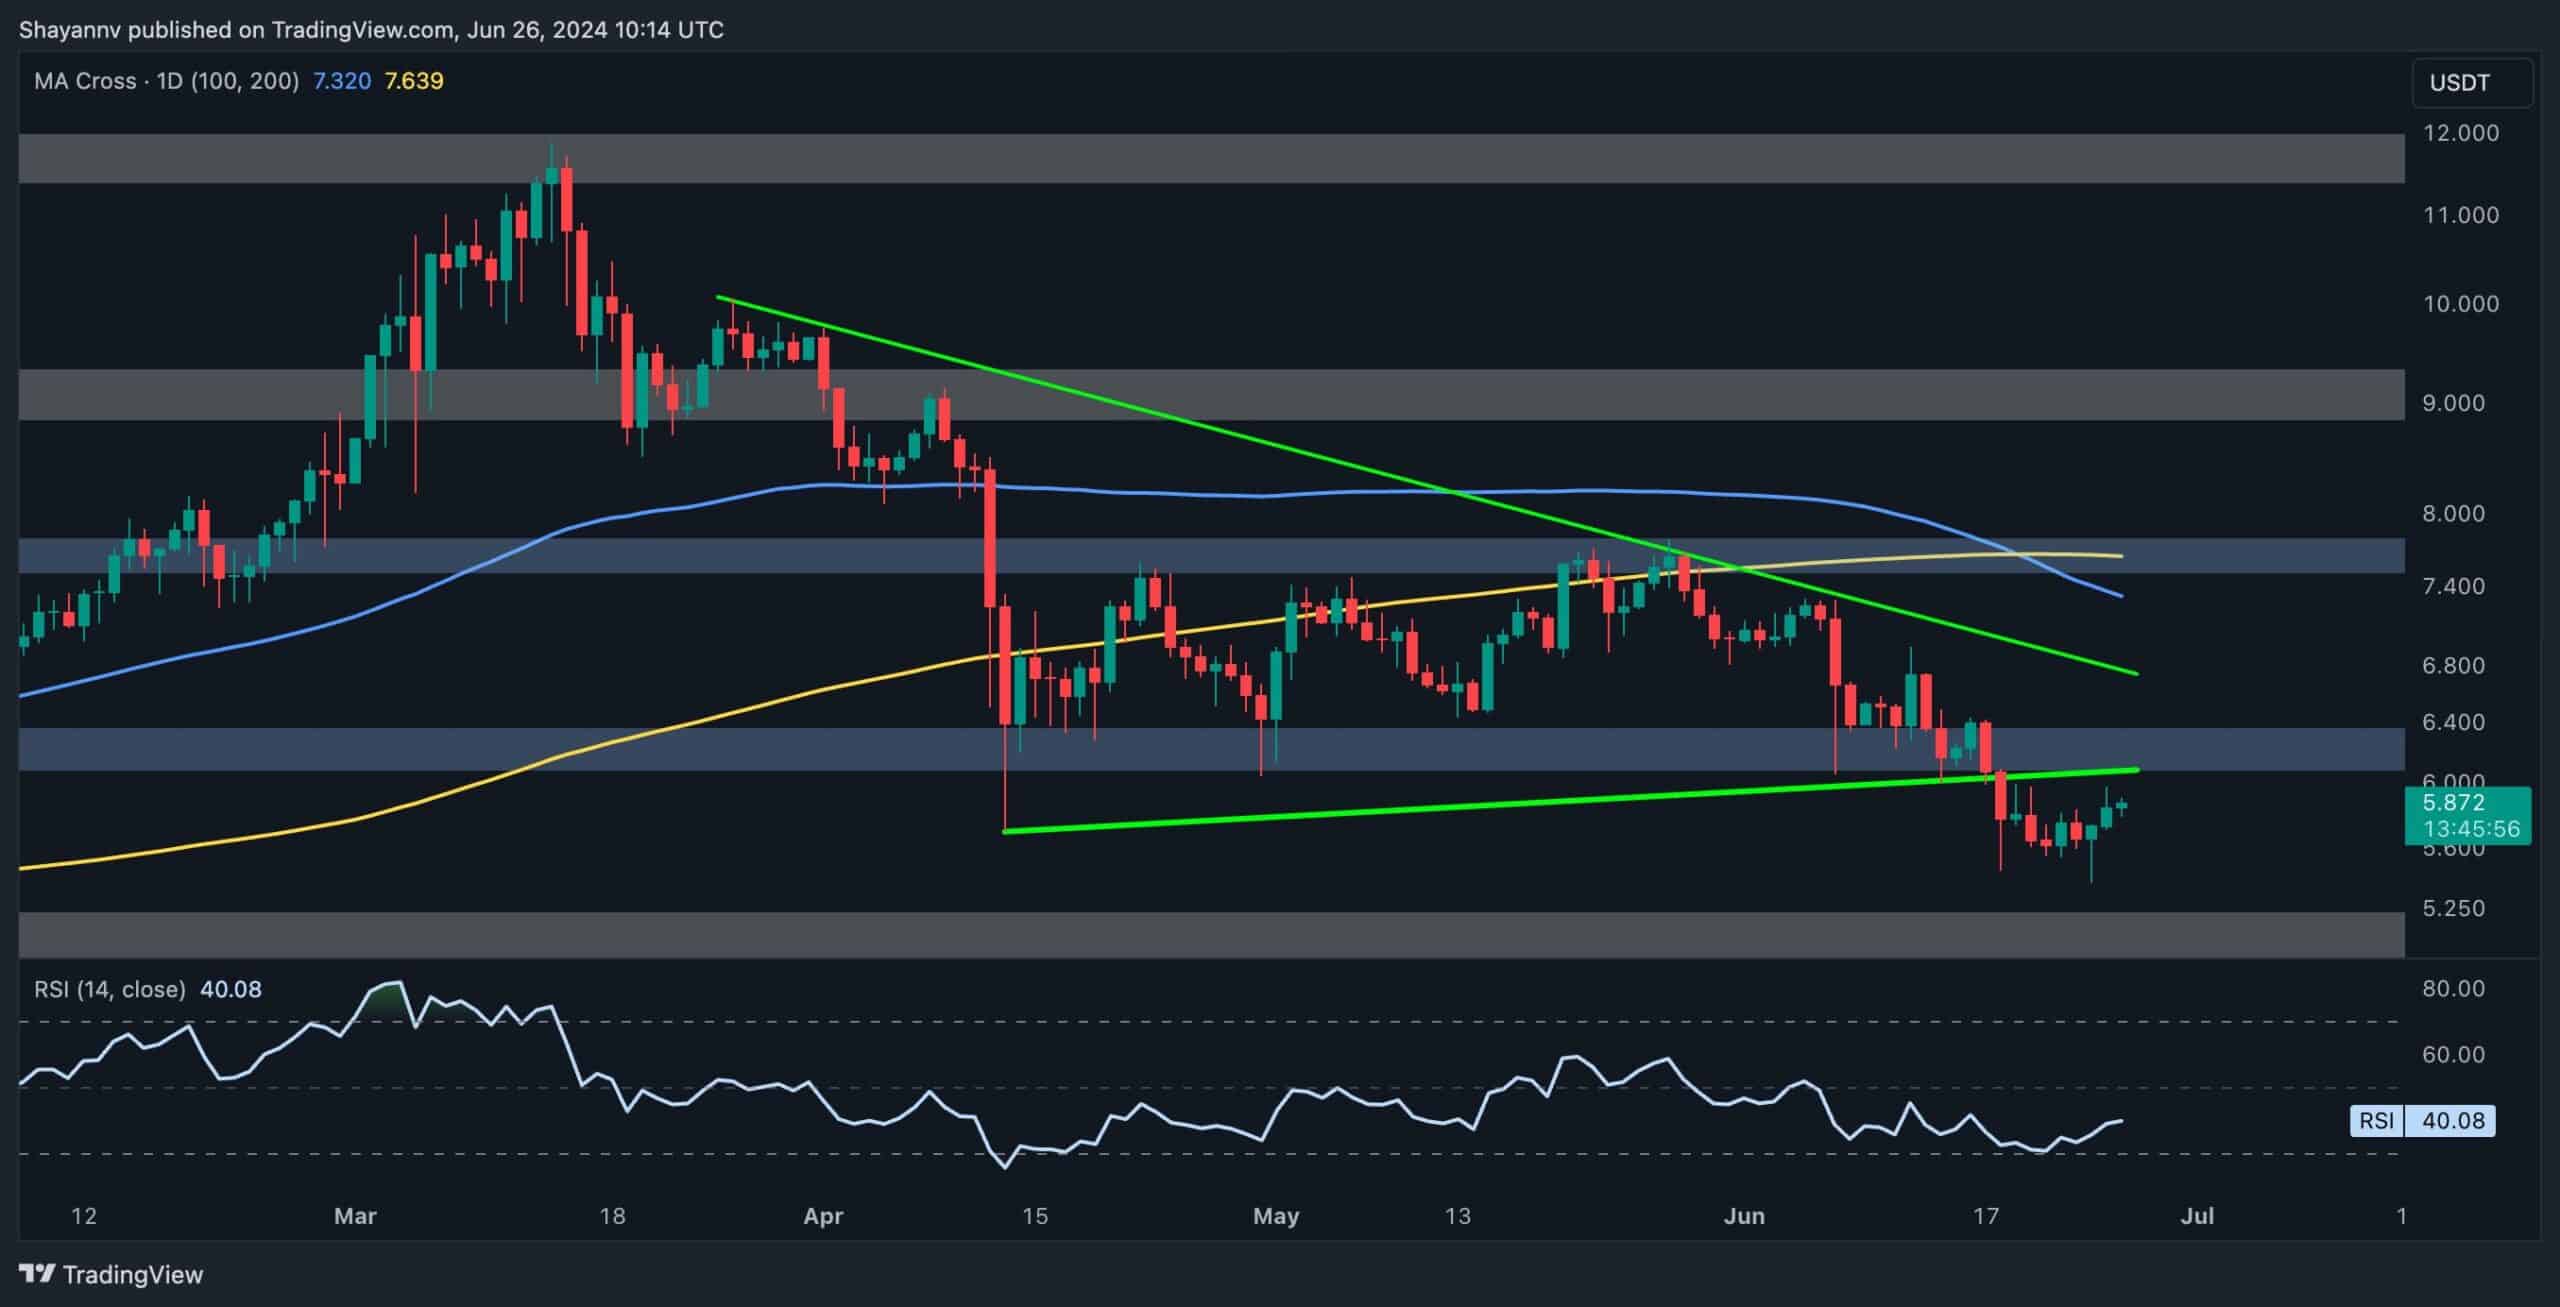
The 4-Hour Chart
On the 4-hour chart, Polkadot’s price action indicates a potential bullish revival, marked by a notable surge after multiple supports at the crucial $5.4 threshold. This surge has led to a break above the short-term descending price channel, suggesting a temporary bullish retracement phase. The price is currently oscillating within a decisive range, defined by the $6.2 critical resistance and the $5.5 substantial support.
Considering the current price action and the apparent bullish divergence between the price and the RSI indicator in the 4-hour timeframe, Polkadot may aim for the range’s upper boundary at $6.2 in the short term. The price action at this level will be crucial in determining the cryptocurrency’s forthcoming trajectory.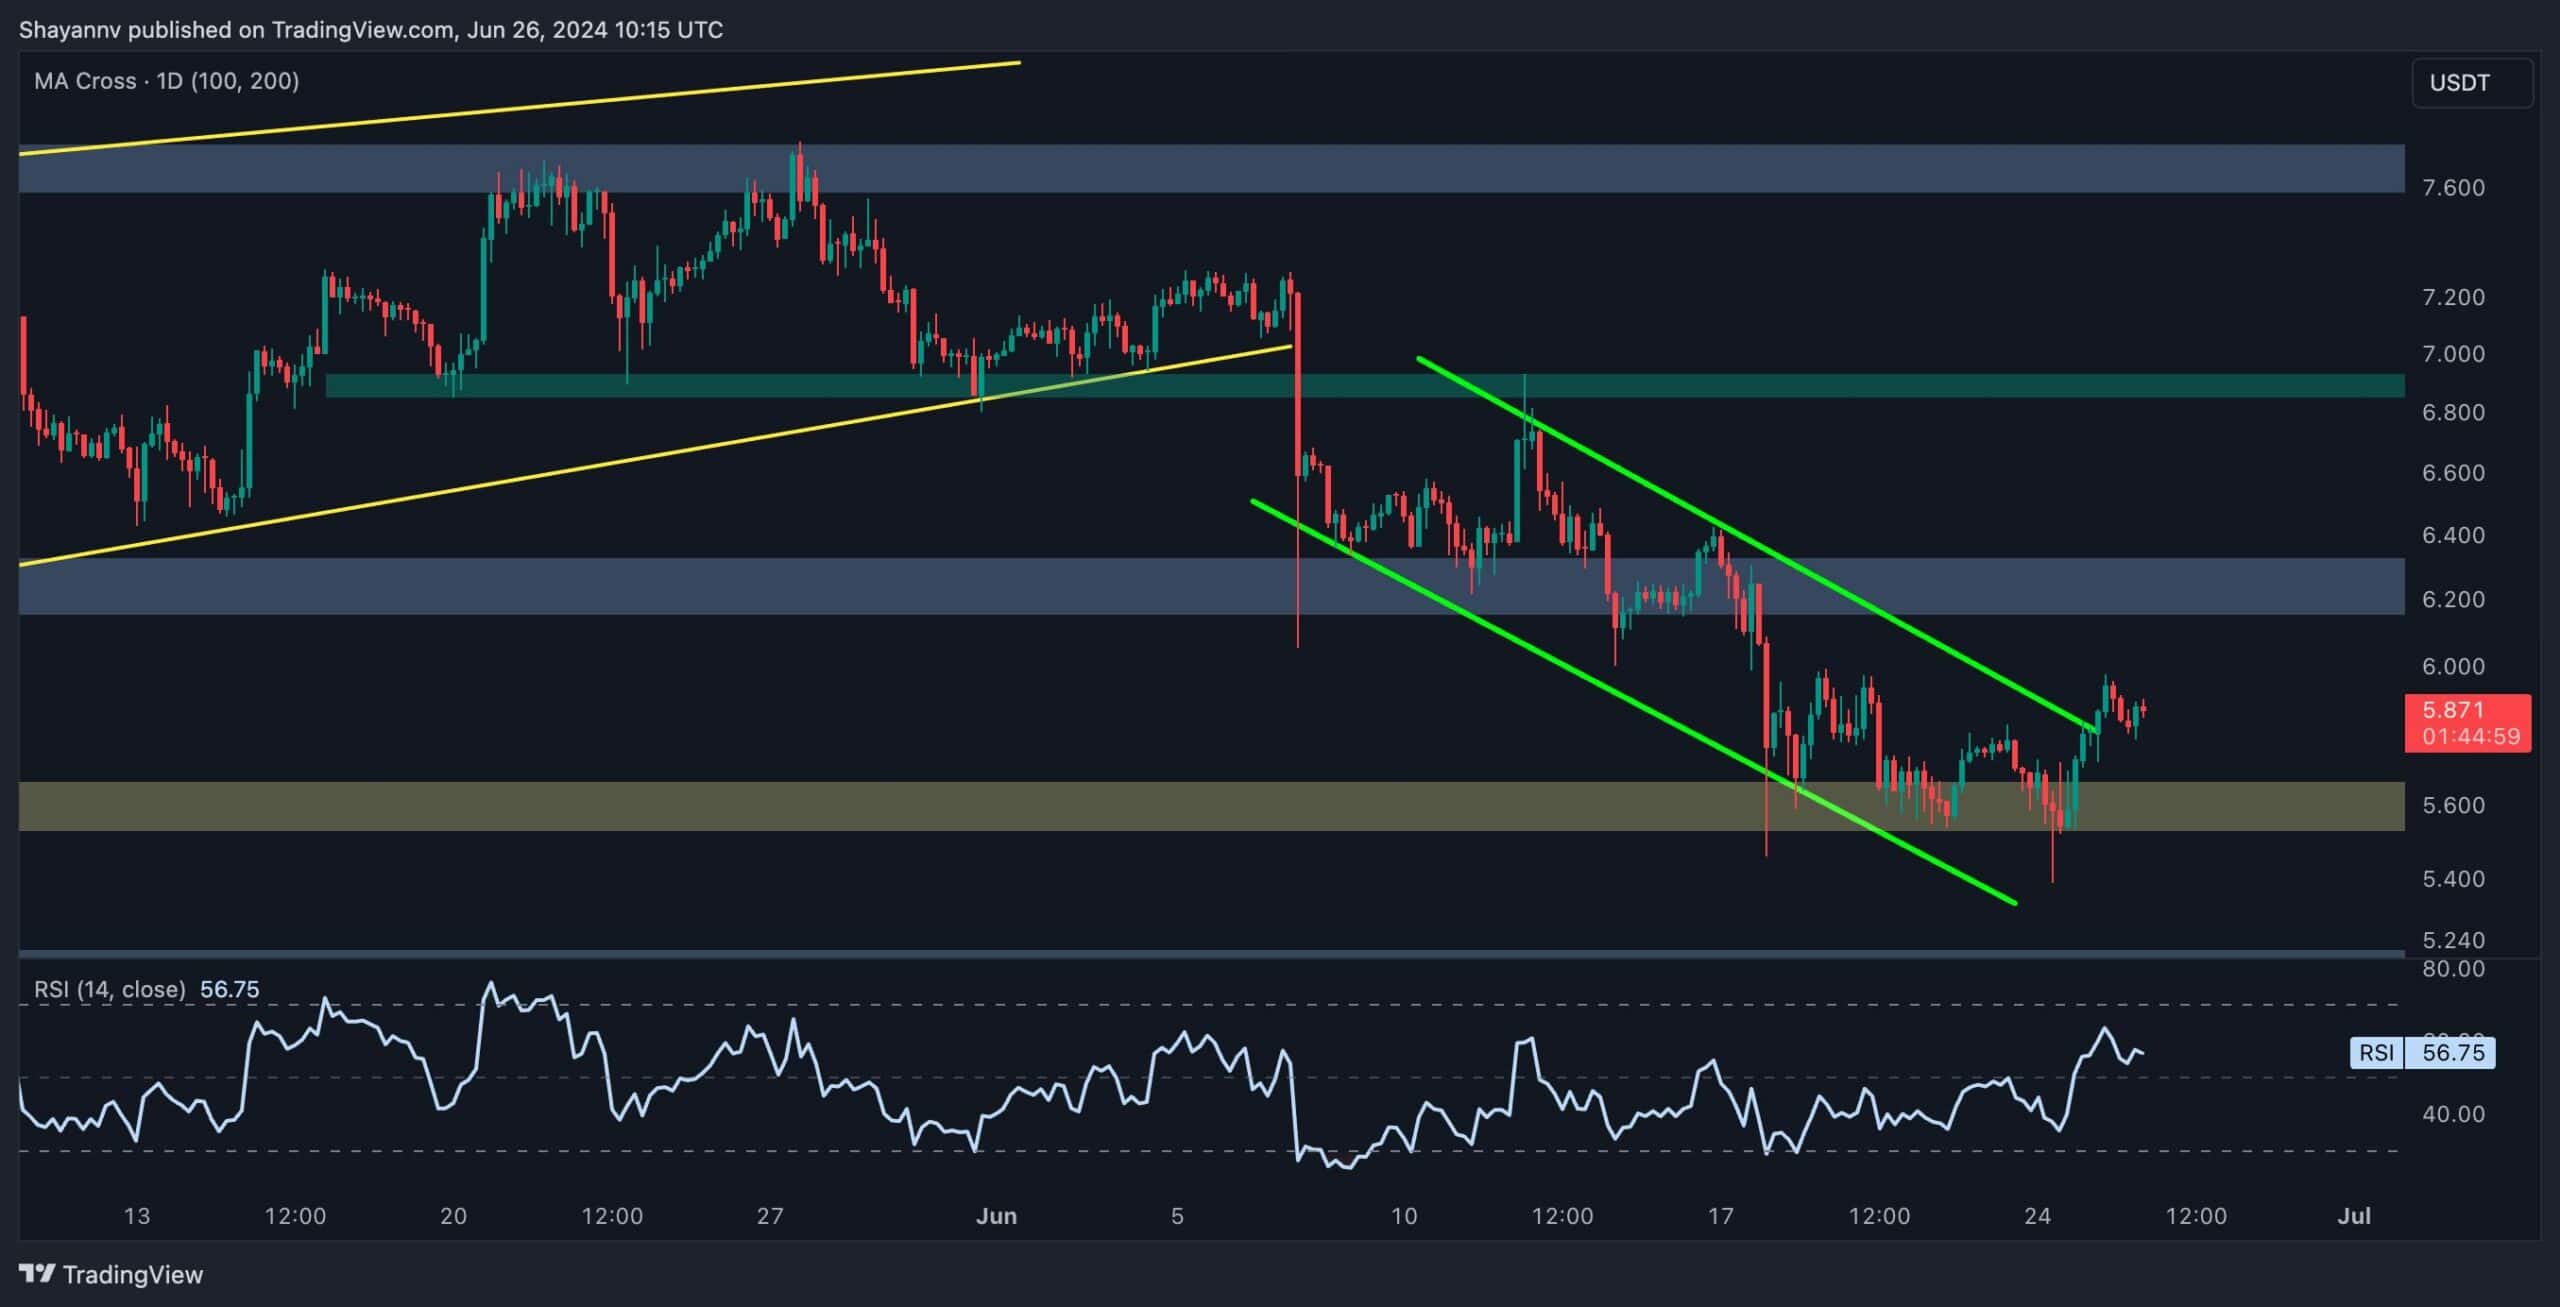
Sentiment Analysis
By Shayan
Polkadot has recently seen an uptick in demand and is nearing the previously broken $6 level. Assessing the supply near this pivotal mark is crucial for making informed trading decisions.
The accompanying chart highlights potential liquidation levels in Polkadot’s price action, offering valuable insights into focus areas for smart money in the mid-term. A significant amount of liquidity is positioned above the crucial $6 resistance region, aligning with the triangle’s lower boundary.
This area is likely to act as a strong resistance, validating the pullback. Therefore, if sellers overcome buyers around this pivot as anticipated, the price may initiate a new bearish trend in the mid-term.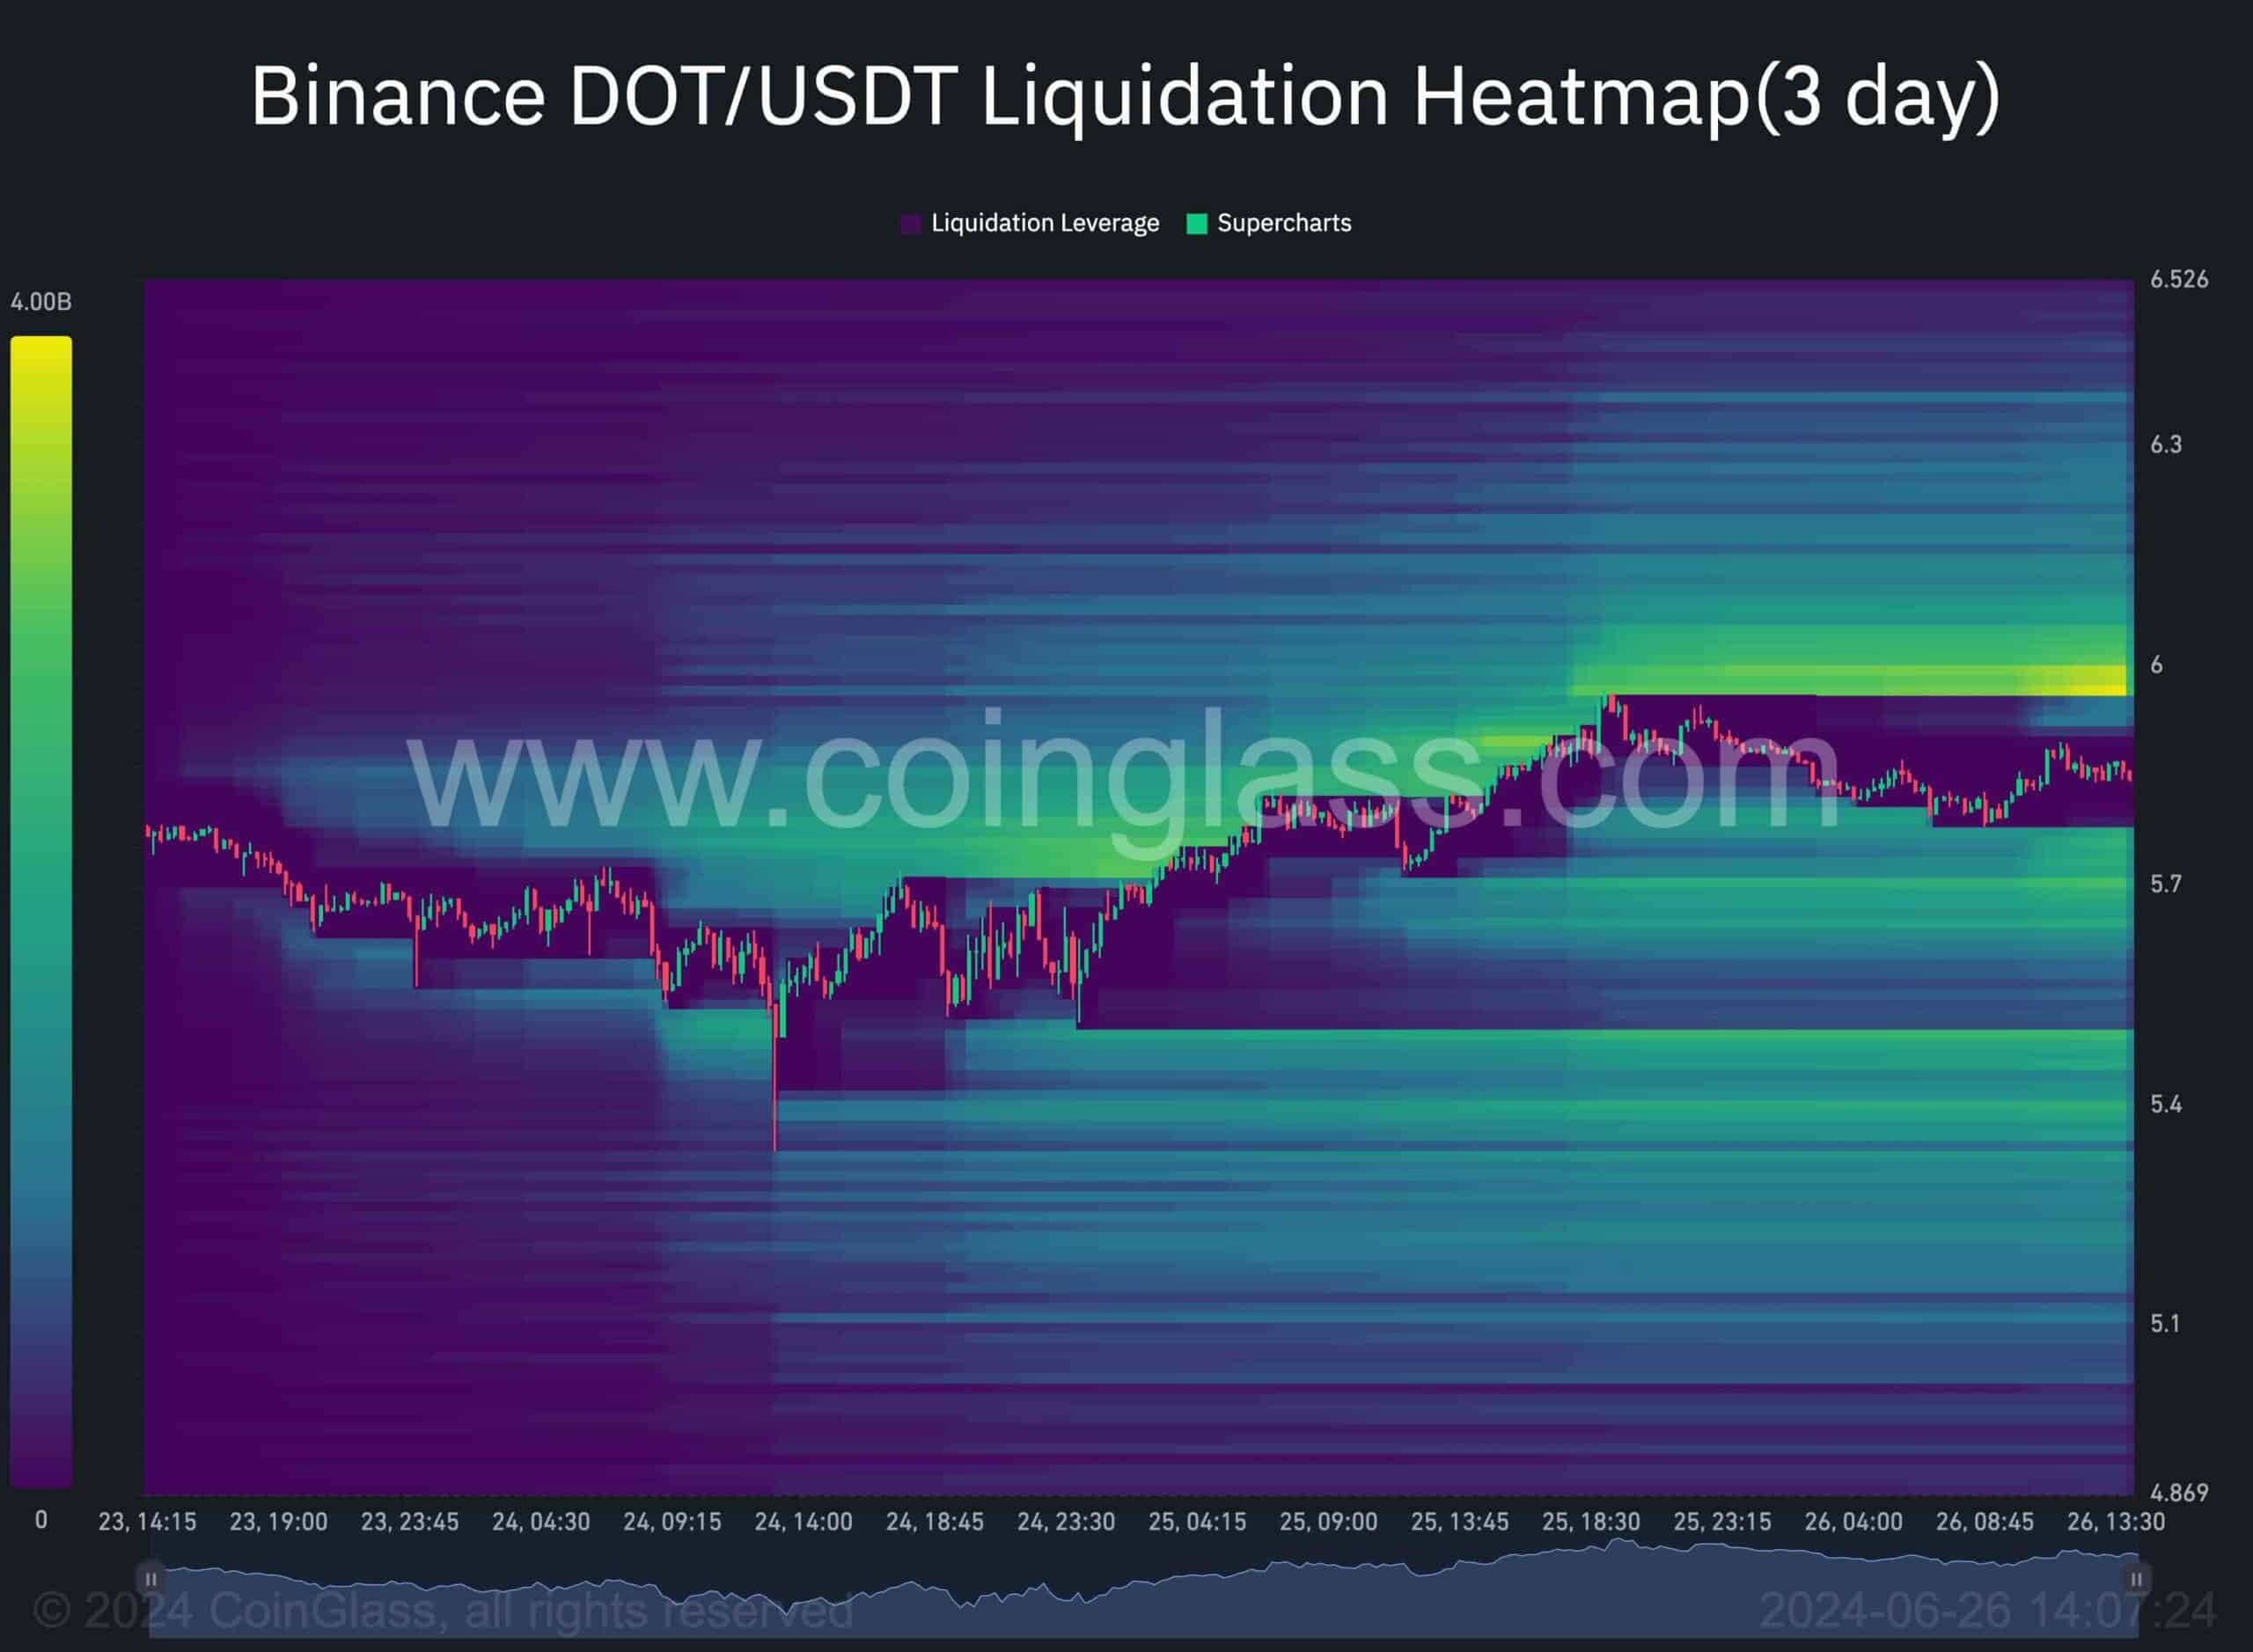
The post Polkadot Price Analysis: Where Is DOT Heading Next After Losing the $6 Level? appeared first on CryptoPotato.