Polkadot Price Analysis: DOT Explodes 11% in 24 Hours, Here’s the Next Target
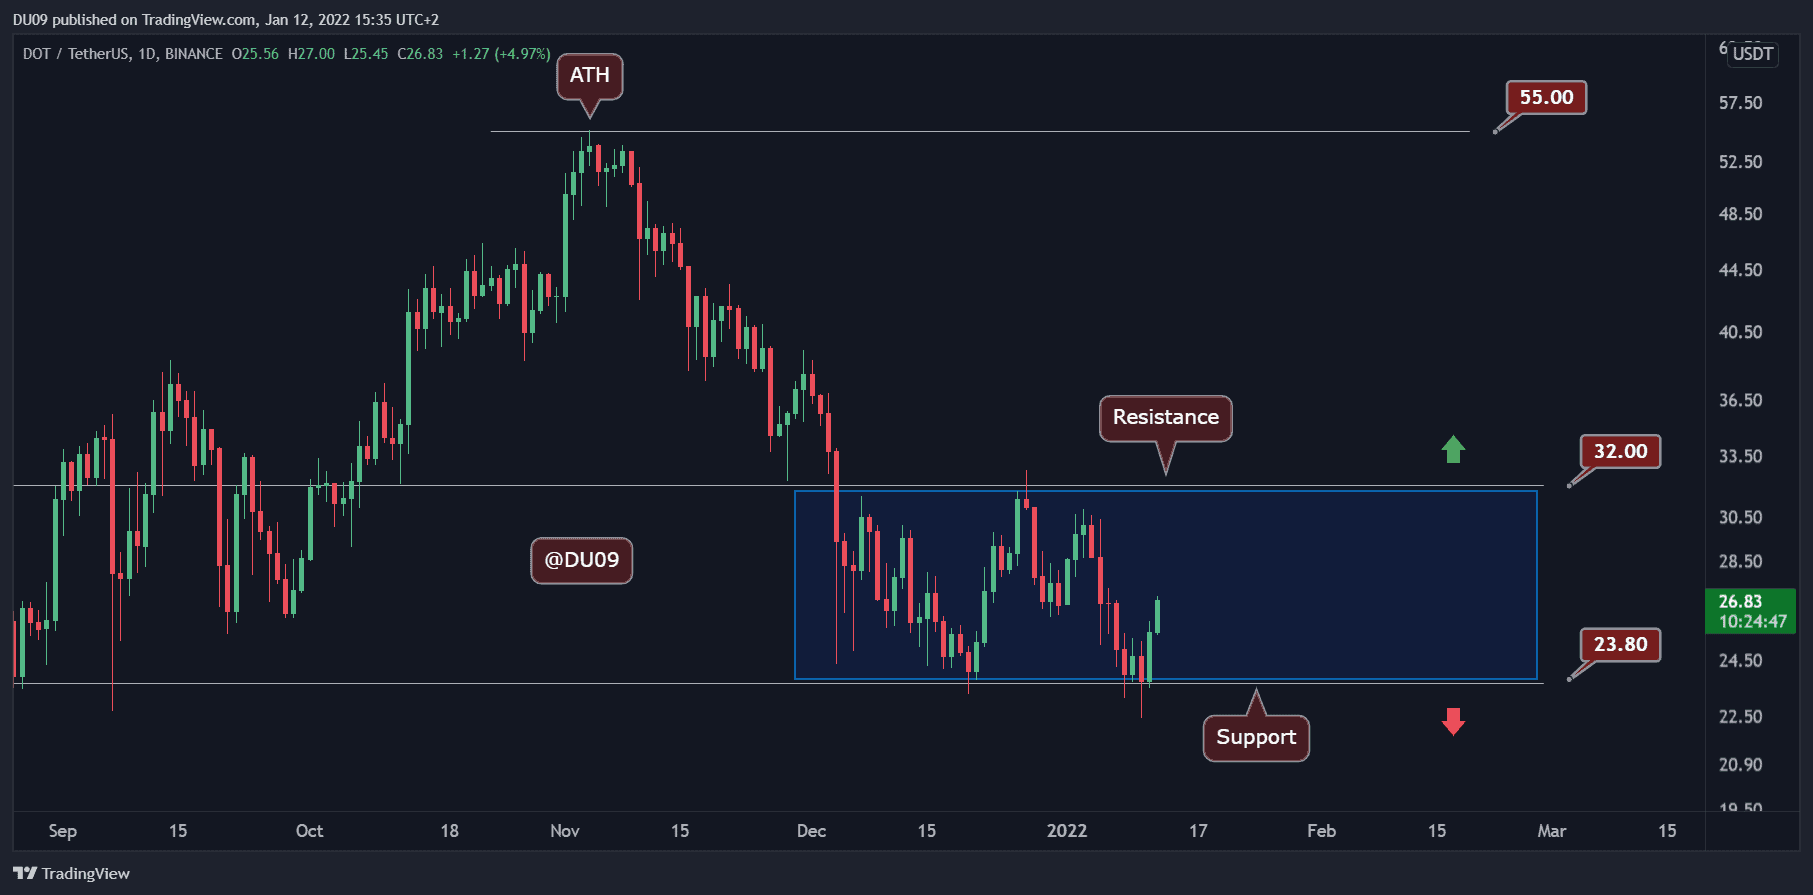
Key Support level: $23
Key Resistance level: $32
Polkadot briefly fell under $23, but it’s been up only ever since. Throughout the recovery, the RSI has formed a large bullish divergence compared to the low on December 20th. This has turned the momentum bullish for DOT, which is now moving quickly towards the key resistance at $32.
Technical Indicators
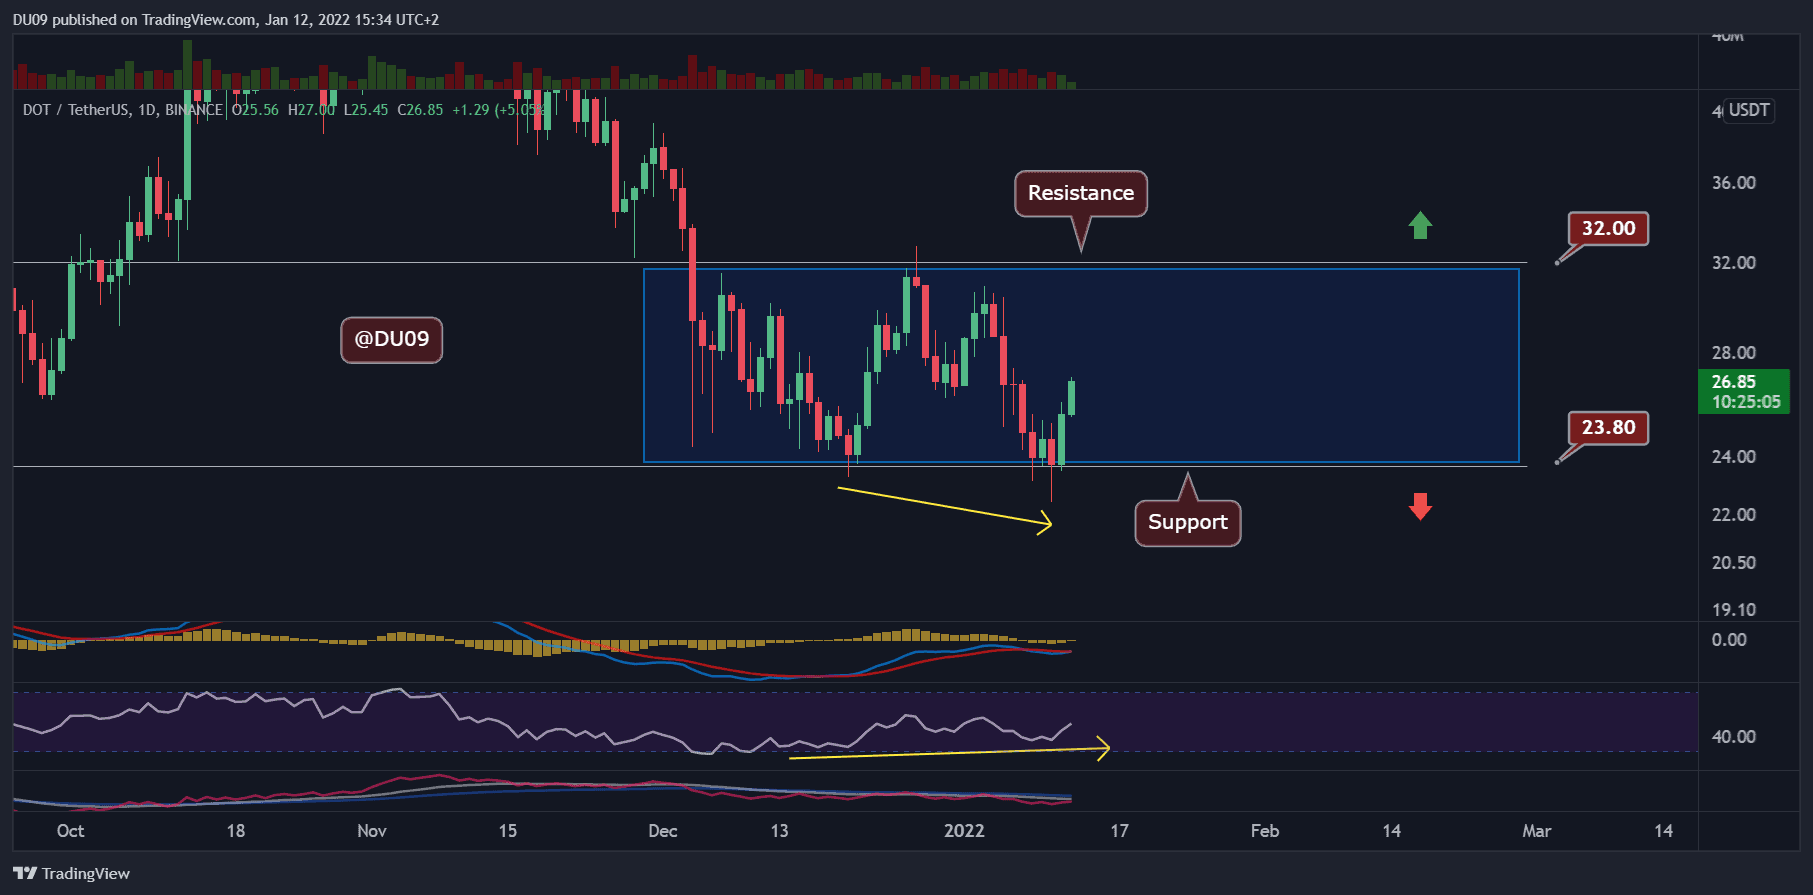
Trading Volume: This current move higher is on good volume, but nothing is out of the ordinary, looking at the past weeks.
RSI: The daily RSI made a clear bullish divergence as indicated on the chart below by the yellow arrows. This was a signal for buyers that it was time to pay attention to DOT, and the price is now showing it.
MACD: The daily MACD is a day away from a bullish cross. This is good news for the bulls as DOT may enter into a sustained rally, at least until it faces the key resistance at $32.
Bias
The bias on DOT is currently bullish. The indicators support this bias, as stated above.
Short-Term Prediction for DOT Price
DOT is on a mission, and the price may soon reach the key resistance at $32. Of course, the overall market momentum is an important thing to keep in proper consideration.