Several altcoins have surrendered their recent gains this week amid rising geopolitical tensions, with Polkadot (DOT) facing similar challenges. The latest market correction pulled the altcoin’s price down to $4.04, a drop of over 14% in just three days.
At times like this, it’s important to take a step back and examine some fundamentals and traders’ sentiment in the face of popular industry analysts’ conclusions.
Polkadot On-Chain
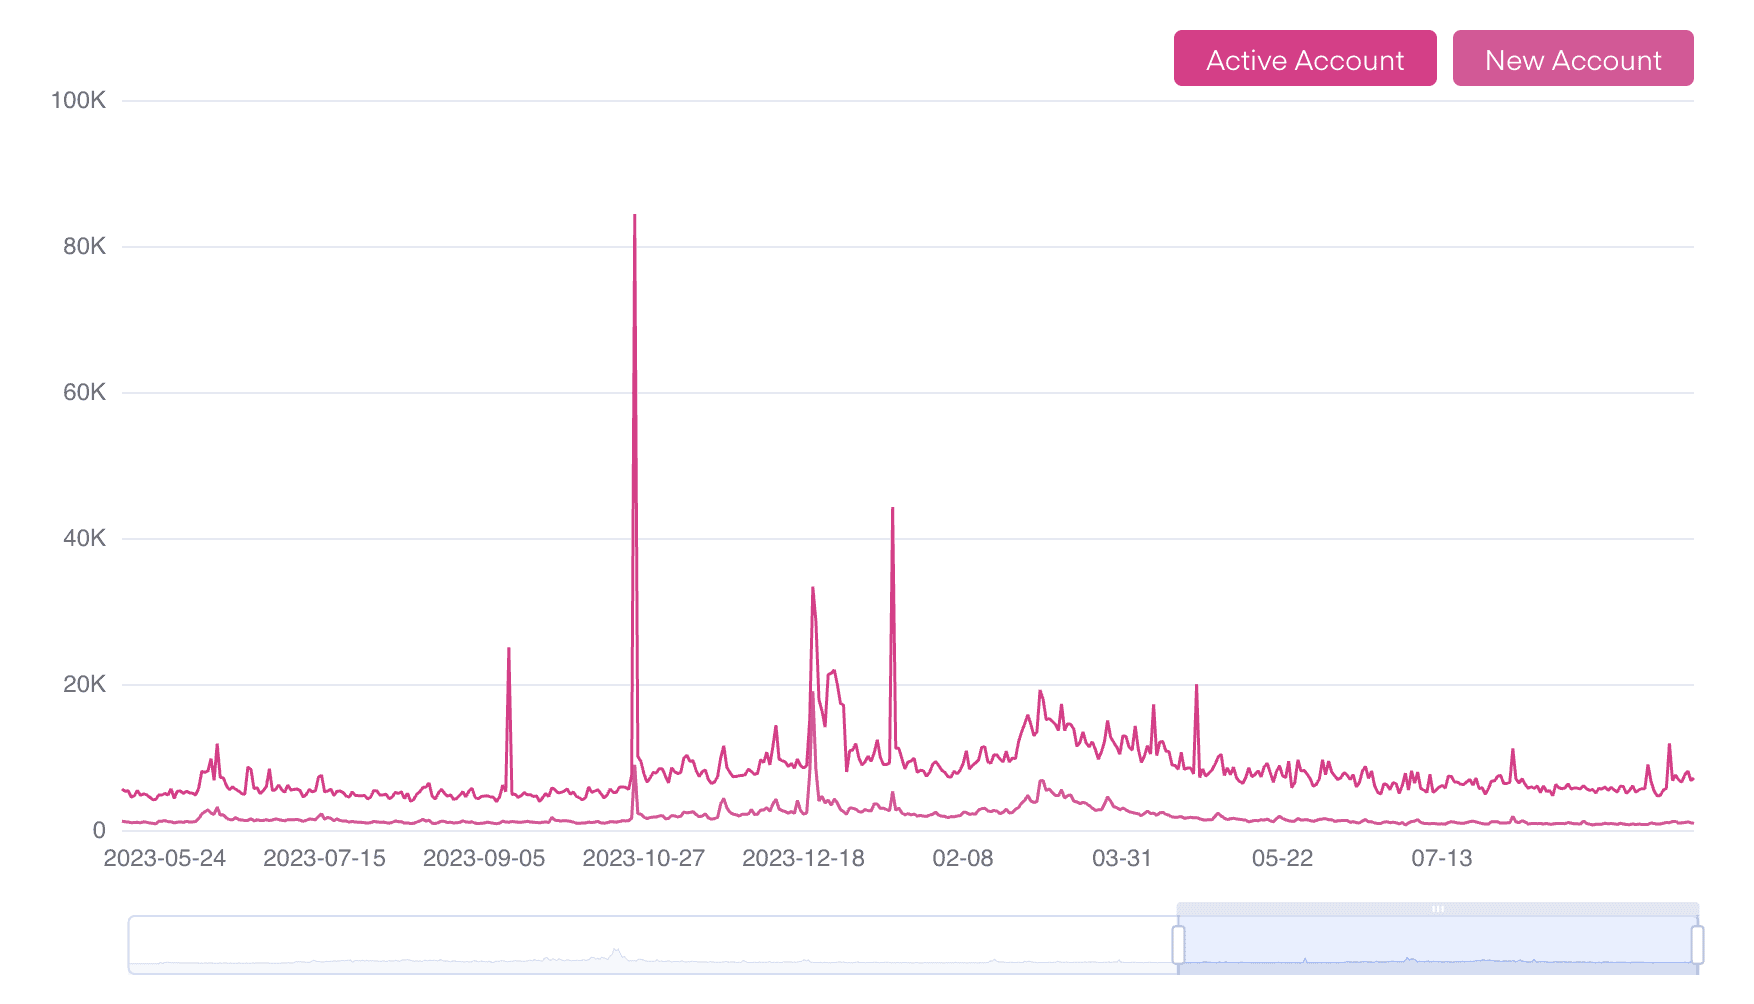
One of the most important on-chain metrics that track the network’s activity over time is the number of daily active users and new users joining the ecosystem.
While the number of new accounts on Polkadot has remained relatively the same since May last year, the number of active users has increased by more than 25%.
Source: Subscan
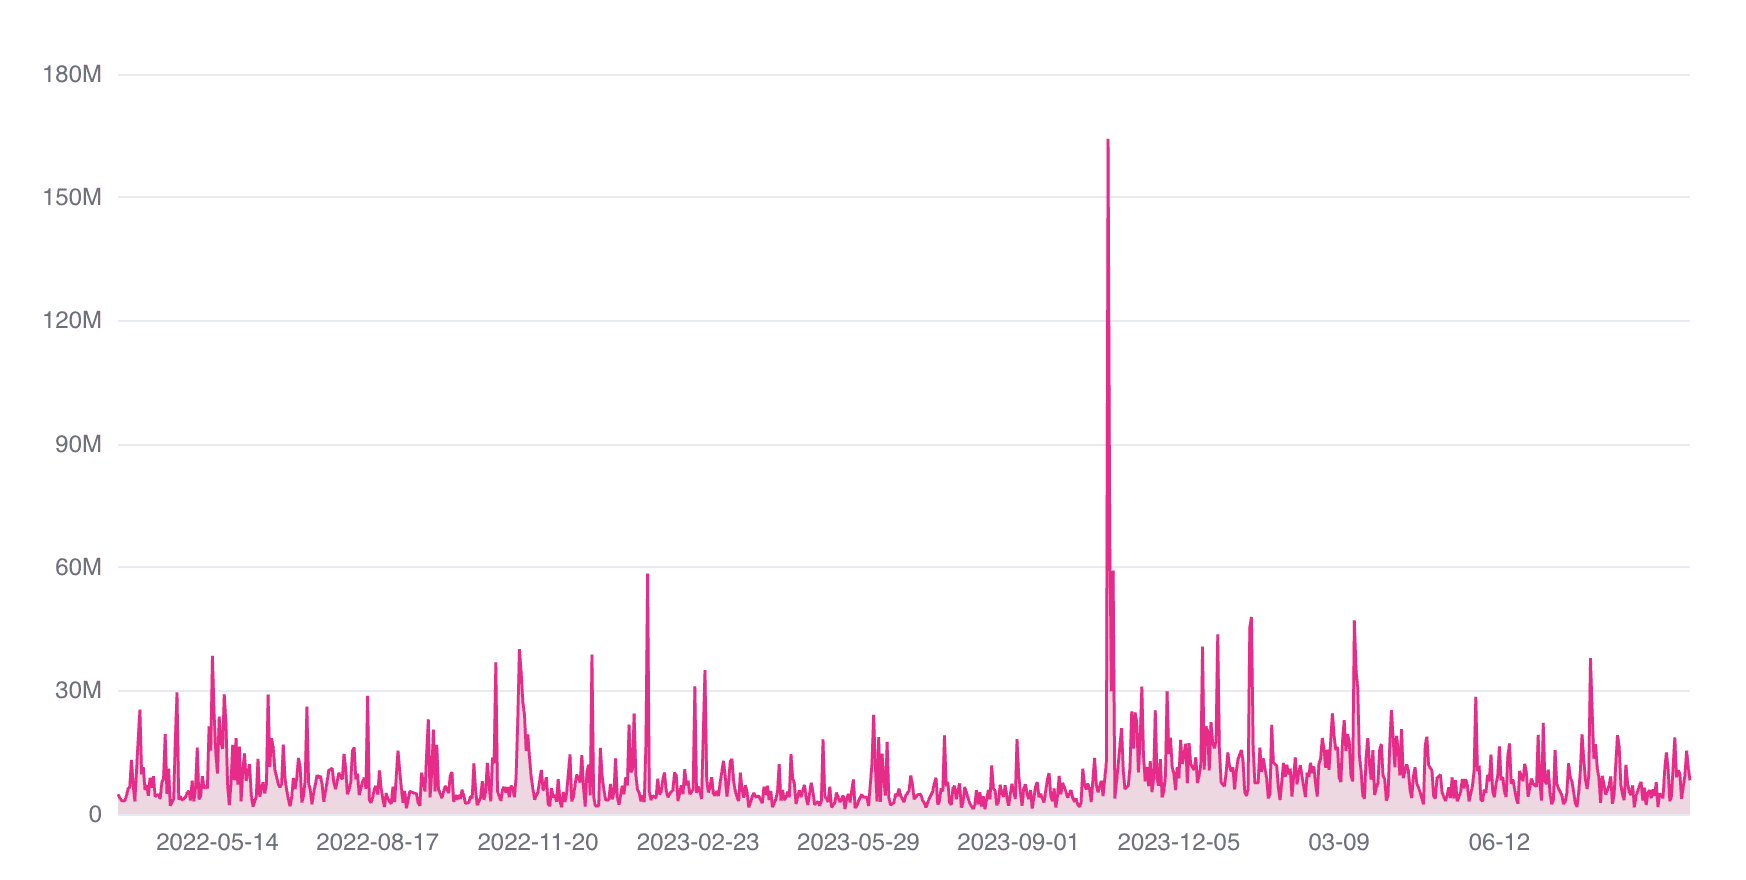
The amount of DOT transferred daily has also increased significantly during this period, showing that the network is processing larger transfer volumes.
Source: Subscan
DOT’s Imminent Breakout – Are Investors Ready?
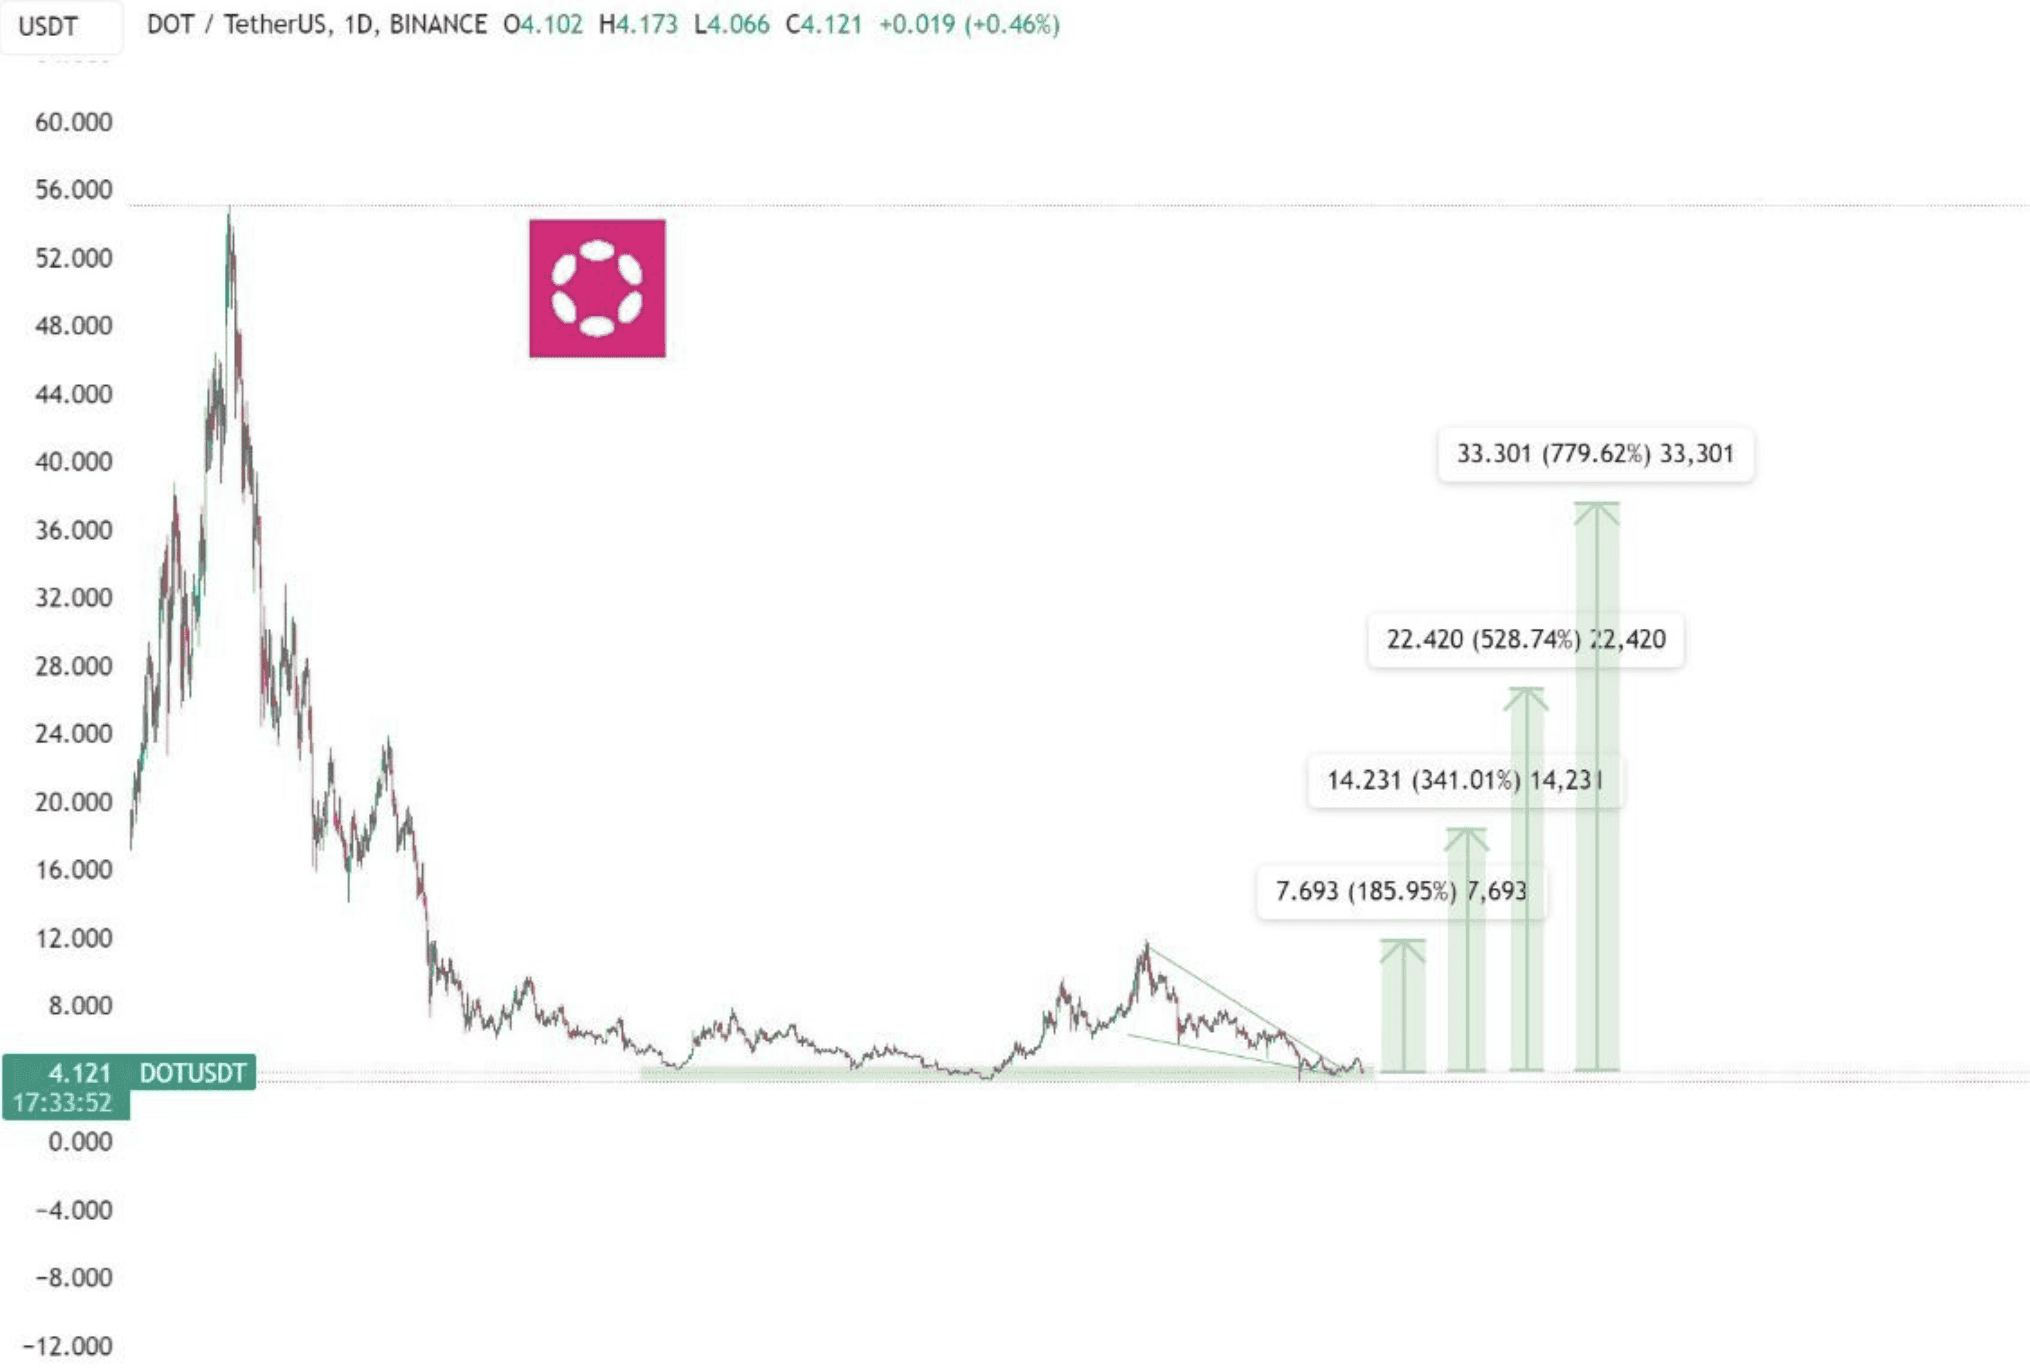
One analysis indicates that DOT is poised for a significant breakout. The altcoin appears to be approaching the conclusion of its accumulation phase and could potentially be on the verge of breaking out of a long-standing falling wedge pattern.
According to its findings, recent movements in major large-caps suggest that DOT is poised to follow this trend, making it only a matter of time before it experiences a substantial upward shift. The projected targets for this breakout, indicating key resistance levels, are set at $11.83, $18.41, $26.30, and $37.53.
“With over 600 days below the key zone, Polkadot is gearing up for a major push.”
Source: X
Another market observer, Lucky, also highlighted a similar promising outlook for DOT in his latest technical analysis. He said that the asset is nearing the end of its yearly accumulation phase, which could propel DOT’s price to “take off” soon.
An Outrageous Scenario Based on Historic Similarities
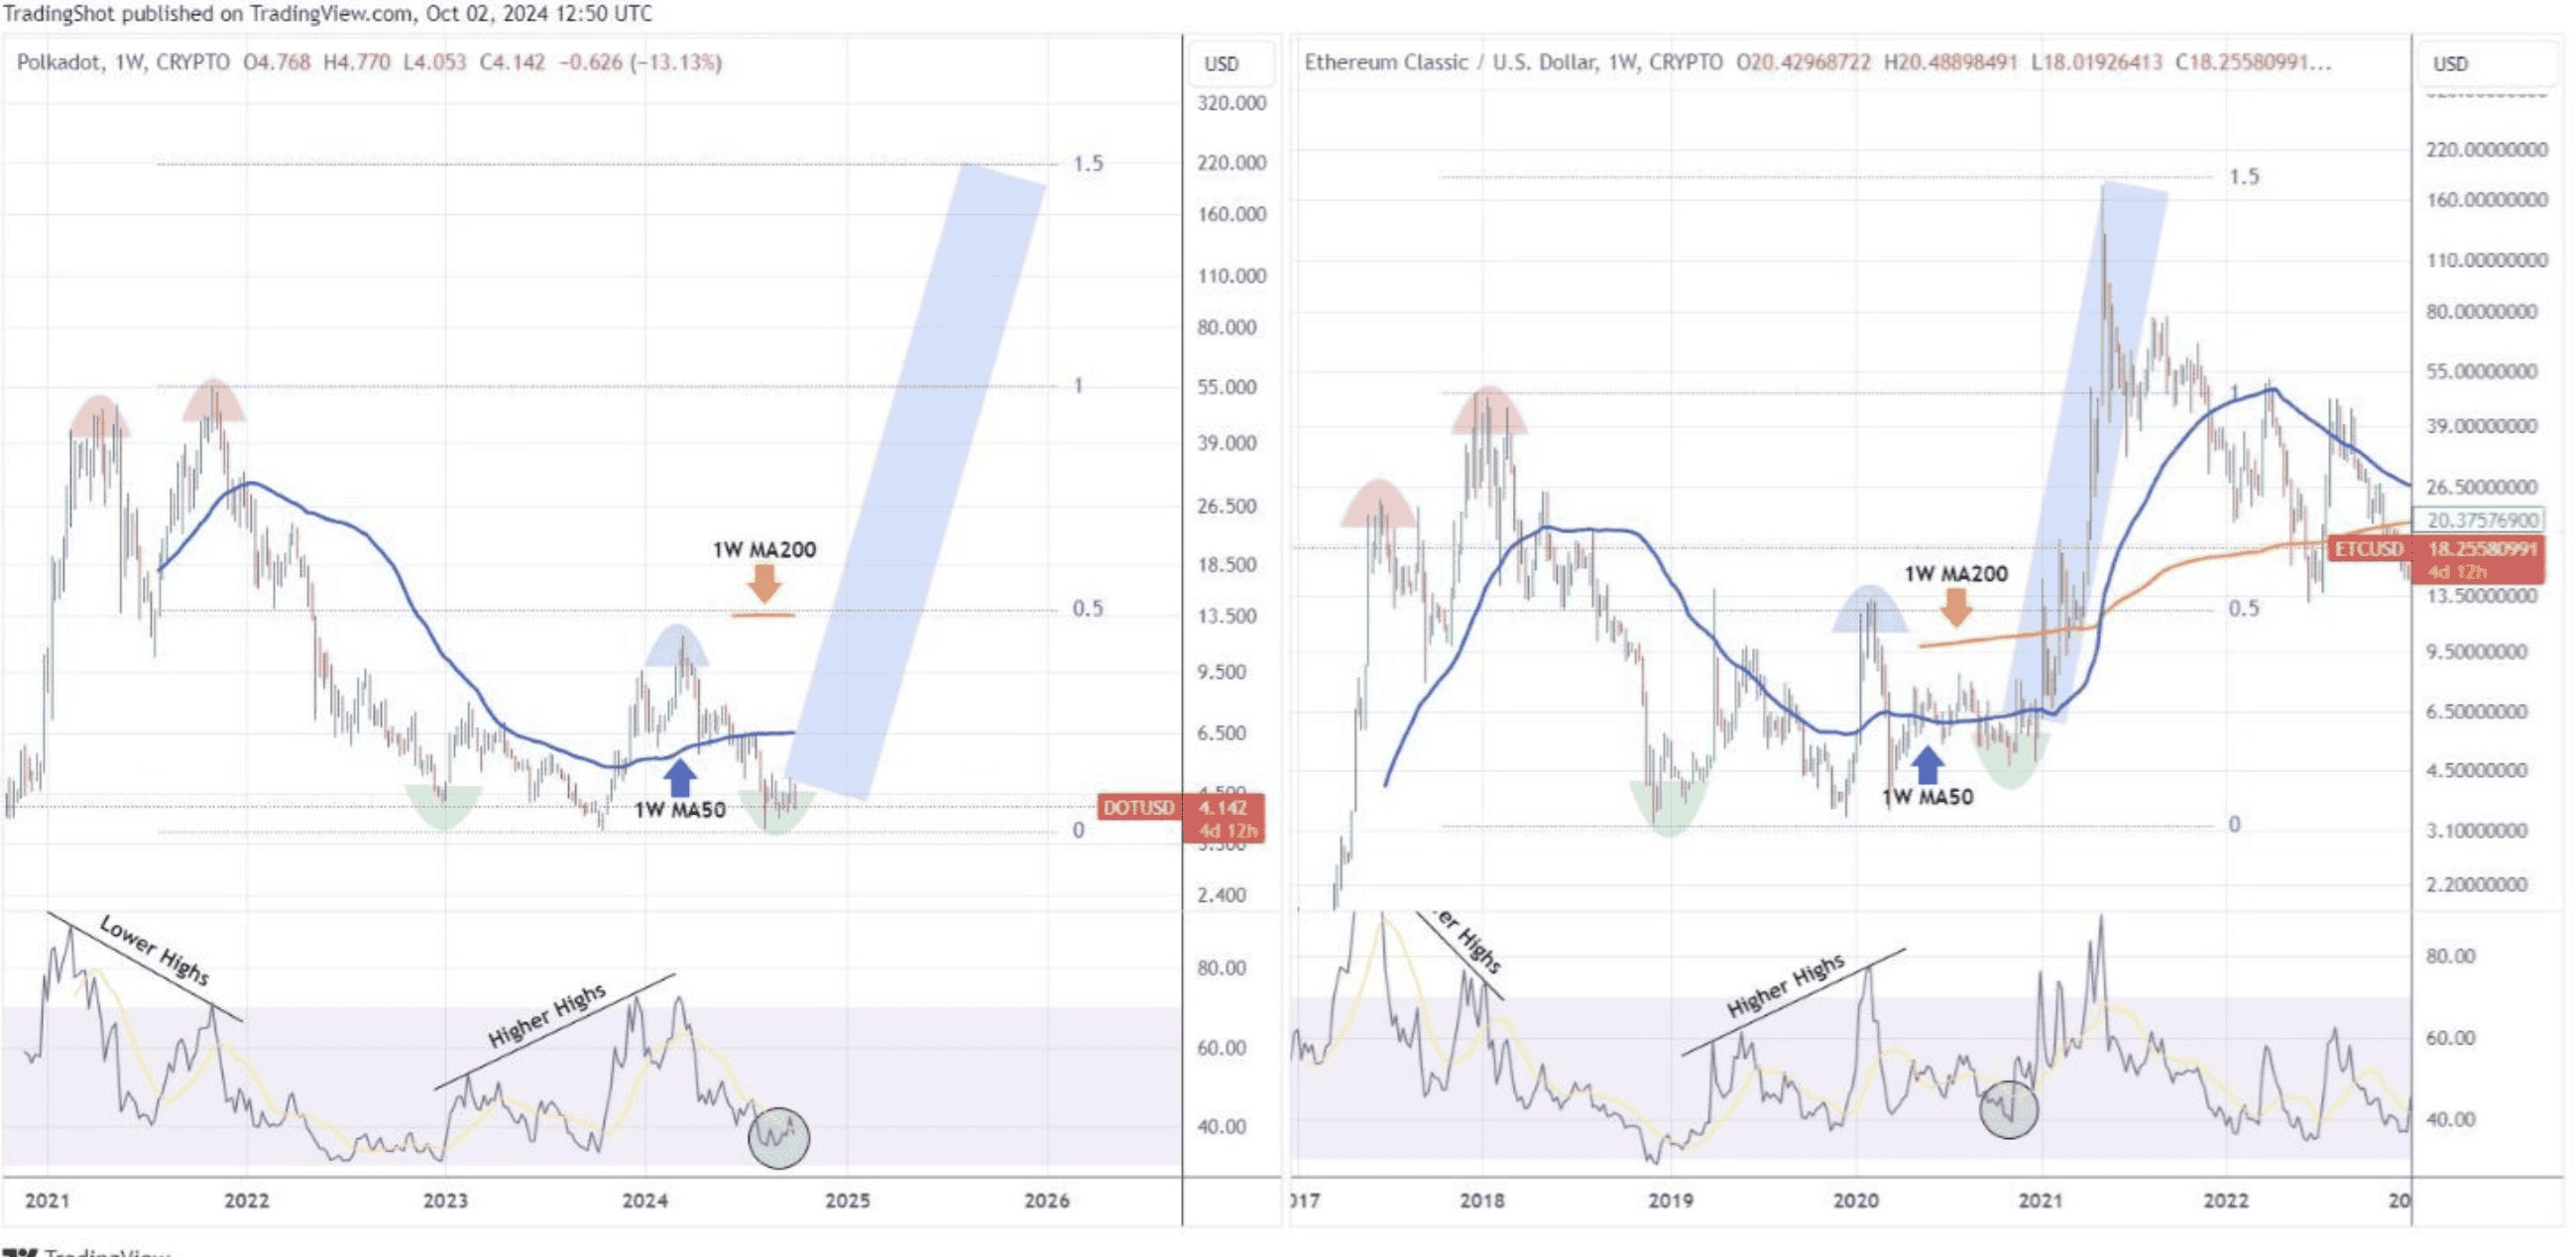
According to investment firm TradingShot’s latest analysis, DOT may be on track for a significant price surge, potentially reaching $200 by the end of 2025. The analysis suggests that Polkadot is following a pattern similar to Ethereum Classic’s (ETC) 2018-2021 cycle.
As shown on a one-week chart, both assets exhibit nearly identical RSI sequences. Lower highs and double tops lead into a bear market, followed by an RSI bottom that sparks a breakout above the one-week MA50 and the 0.5 Fibonacci retracement level.
Source: X
Currently, Polkadot’s RSI is hovering around 40.00, a key level that marked the start of a parabolic rally in Ethereum Classic. If Polkadot mirrors this cycle, it could aggressively rise toward the 1.5 Fibonacci extension, hitting $200 by late 2025.
The post Polkadot in the Charts: What do On-Chain Data and Technical Analysis Indicate for DOT’s Price? appeared first on CryptoPotato.
Cryptocurrency custody platform BitGo recently announced plans to transfer its Wrapped Bitcoin (WBTC) business to a joint venture with Hong Kong-based BiT Global. The move, intended to enhance security through a multi-jurisdictional and multi-institutional custody structure, has caused backlash due to the involvement of controversial crypto figure Justin Sun. Backlash Over Justin Sun’s Involvement In
TL;DR MEW outperformed the leading meme coins, surging by double digits on a daily scale. Its pump occurred shortly after the asset’s inclusion on Binance Alpha. MEW Climbs the Ladder The meme coin sector has seen better days, with many tokens experiencing declines in the past 24 hours. PEPE has fallen by 2%, FLOKI (FLOKI)
Coinbase founder and CEO Brian Armstrong, for one, believes that ideal crypto regulations should start with centralized actors since most of the damage to the consumers has been done by these entities. In a recently released “realistic blueprint,” Armstrong highlighted the need to pursue legislation early instead of waiting for something comprehensive and perfect. Regulations…
[PRESS RELEASE – Singapore, Singapore, February 26th, 2024] Aethir, a leader in decentralized GPU cloud infrastructure, has announced its highly anticipated Node Sale. Aethir is an enterprise-grade, AI and Gaming-focused GPU-as-a-service provider. Aethir’s decentralized cloud computing infrastructure enables GPU providers to connect with enterprise clients who need the raw power of NVIDIA’s H100 chips for
Solana’s (SOL) price has continued to slide this week, dropping another 4% over the past 24 hours to hit $82.60. This decline comes amidst ongoing weakness in the broader crypto market, with Bitcoin (BTC) and Ethereum (ETH) also posting losses. However, while Solana struggles, the new altcoin Bitcoin Minetrix (BTCMTX) has seen enormous success in
A spokesperson for AnChain.AI, a blockchain analytics firm, recently revealed a $600 000+ contract with the Securities and Exchange Commission to help the agency regulate and monitor the DeFi space. AnChain’s Contract with the SEC The contract – which began in May of 2021 – has an initial value of $125 000, which may escalate…
[Press Release – Tortola, BVI, 13th April, 2021, Chainwire] With the tailwinds of a fresh $2.2 million fundraising at its back, Don-Key aims to become the eToro of DeFi by building a comprehensive social platform for yield farming designed to improve accessibility and magnify yield farmers’ potential. Decentralized finance (DeFi) is finally capitalizing on blockchain’s…
[PRESS RELEASE – Amsterdam, Netherlands, February 29th, 2024] Scantrust and LTO Network Partnering for Secure, Transparent items. Scantrust’s innovative Secure QR codes, a well-known and proven tool against counterfeiting, can now be used in conjunction with LTO Network’s secure, transparent blockchain technology. This allows organizations that depend on critical documents and high-value, luxury goods to
It has taken bitcoin less than seven days to break its all-time high (again) and chart a new one of just shy of $94,000. This has put its market capitalization to around $1.850 trillion, which makes it the seventh-largest asset by that metric in the world. Bitcoin/Price/Chart 19.11.24. Source: TradingView The primary cryptocurrency went on