Polkadot Can Target $10 Next, but Here’s the Catch (DOT Price Analysis)
Polkadot faces a significant challenge in reclaiming a decisive resistance region encompassing the $7.5 mark, the 100-day moving average, and critical Fibonacci levels. This resistance range can potentially halt upward pressure in the short term.
Technical Analysis
By Shayan
The Daily Chart
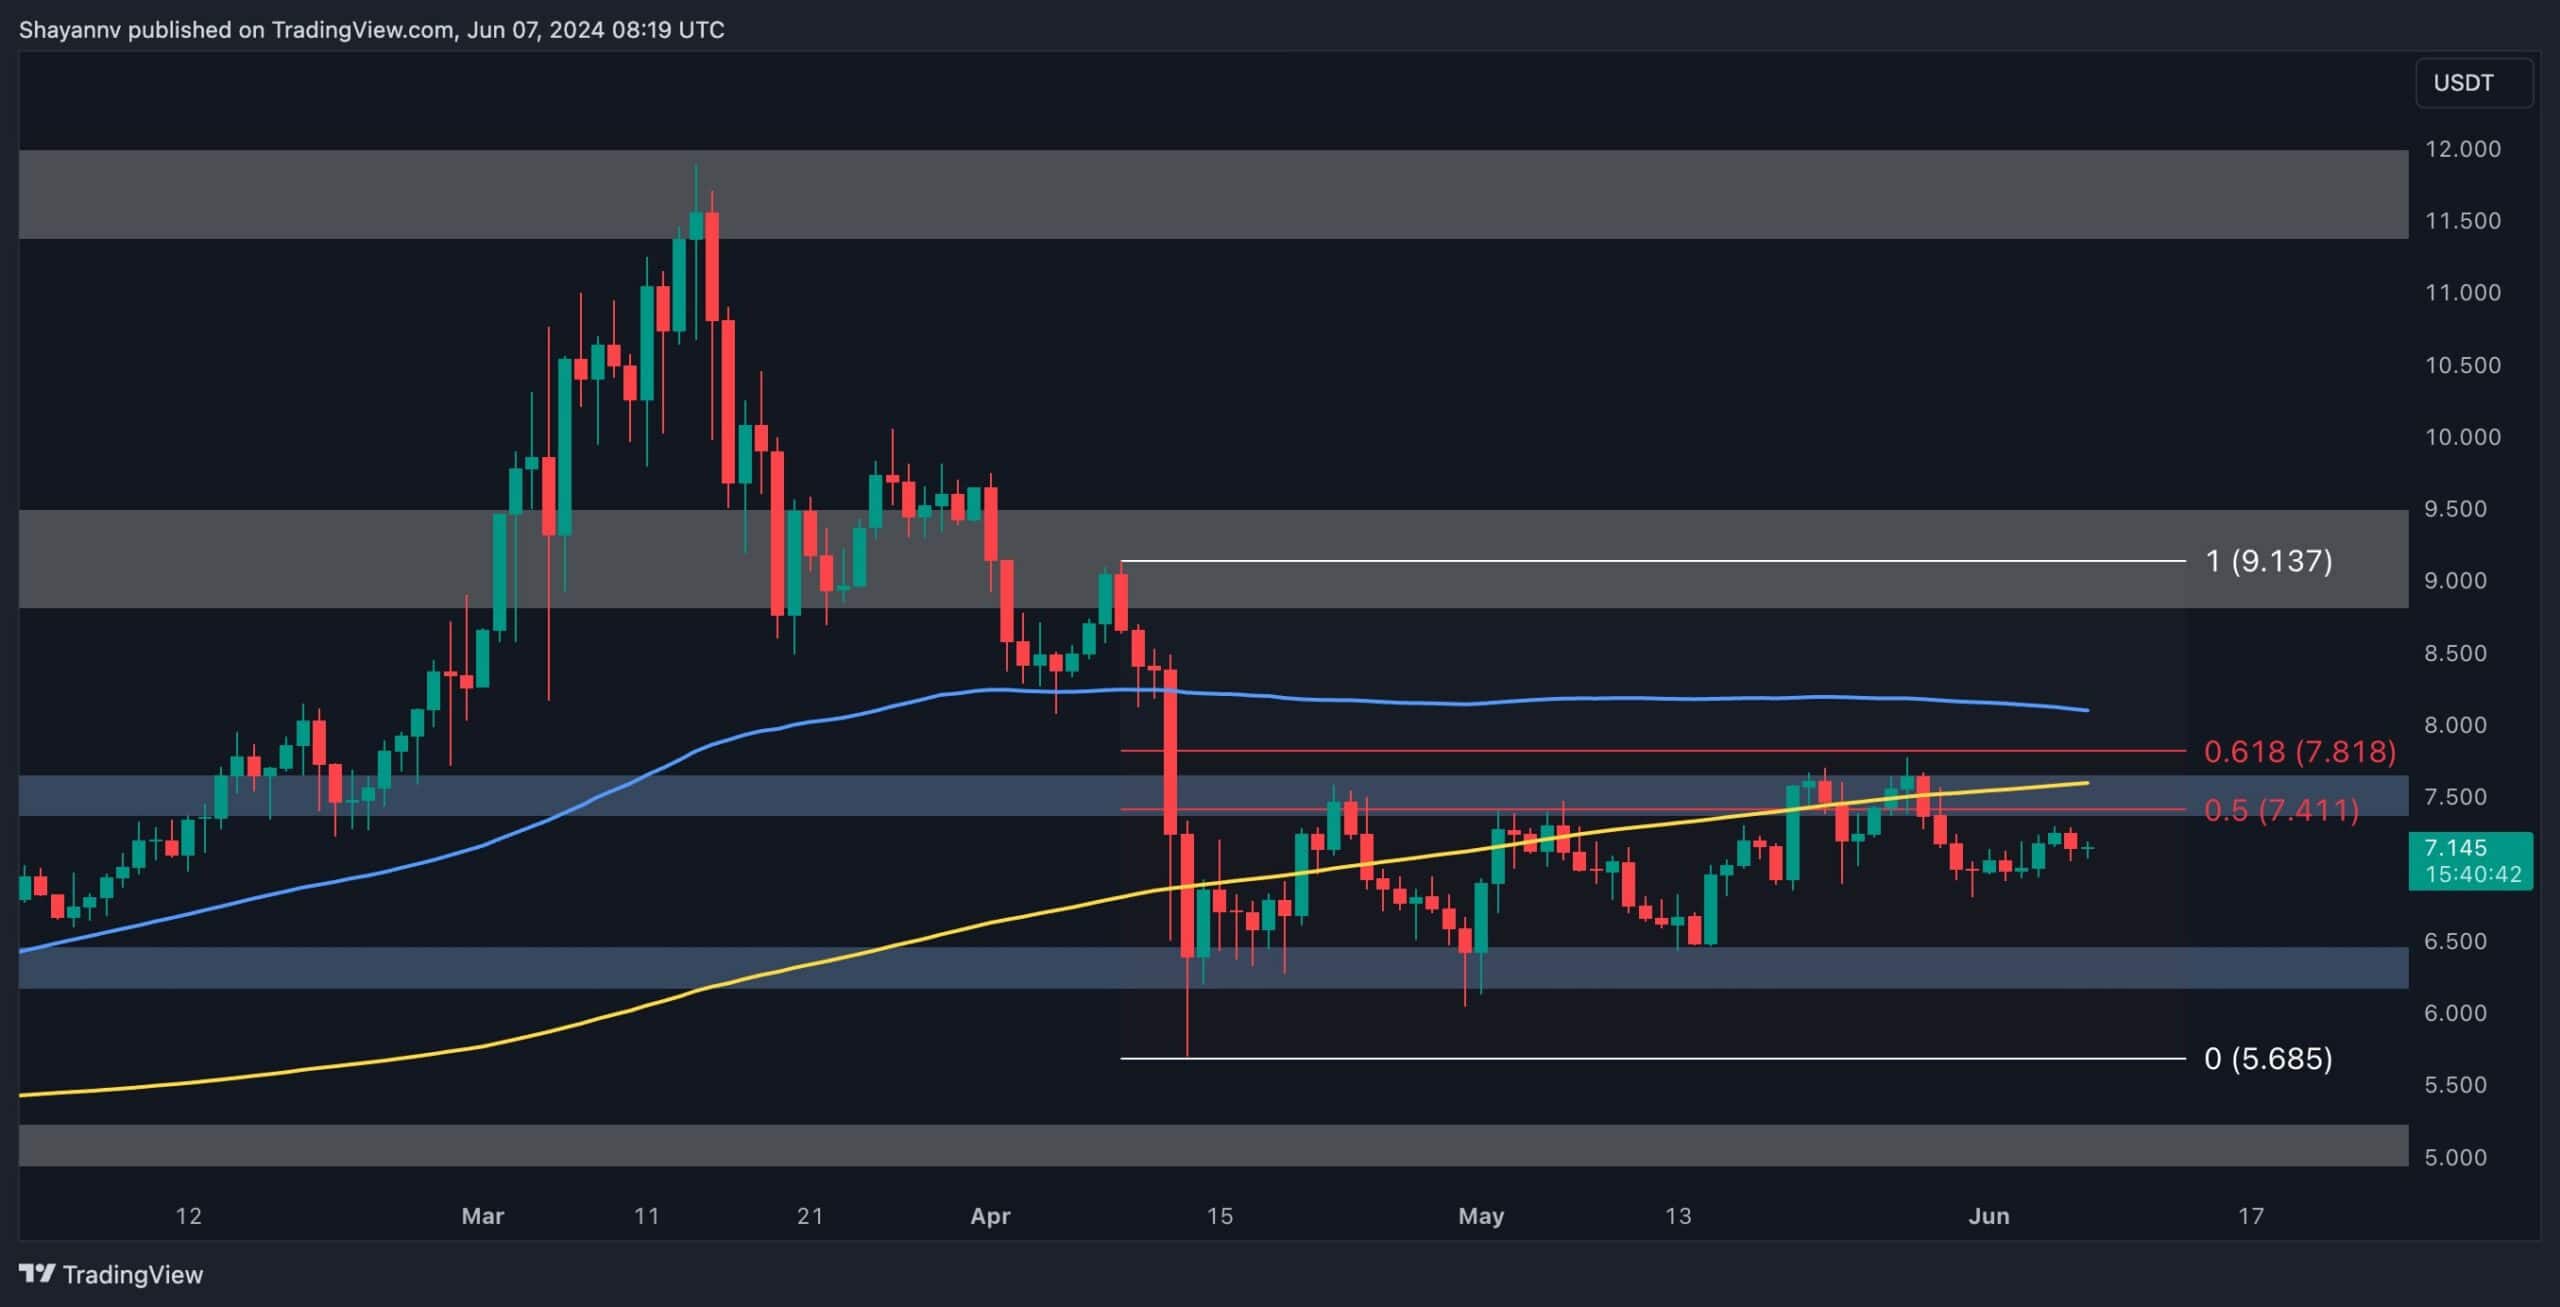
A comprehensive daily chart analysis highlights Polkadot’s prolonged struggle to breach a crucial resistance zone over several weeks. This resistance includes:
- The static resistance level at $7.5
- The 100-day moving average at $7.6
- The price range between the 0.5 ($7.4) and 0.618 ($7.8) Fibonacci levels
This formidable range is likely accompanied by significant supply and selling pressure, capable of resisting buyers’ upward momentum. In the event of a rejection, the consolidation phase is expected to expand, with the price retracing slightly towards the $6.5 support region.
Conversely, if buyers successfully overpower sellers, a notable short-squeeze event could transpire, propelling the price impulsively toward the $8 threshold.
The 4-Hour Chart
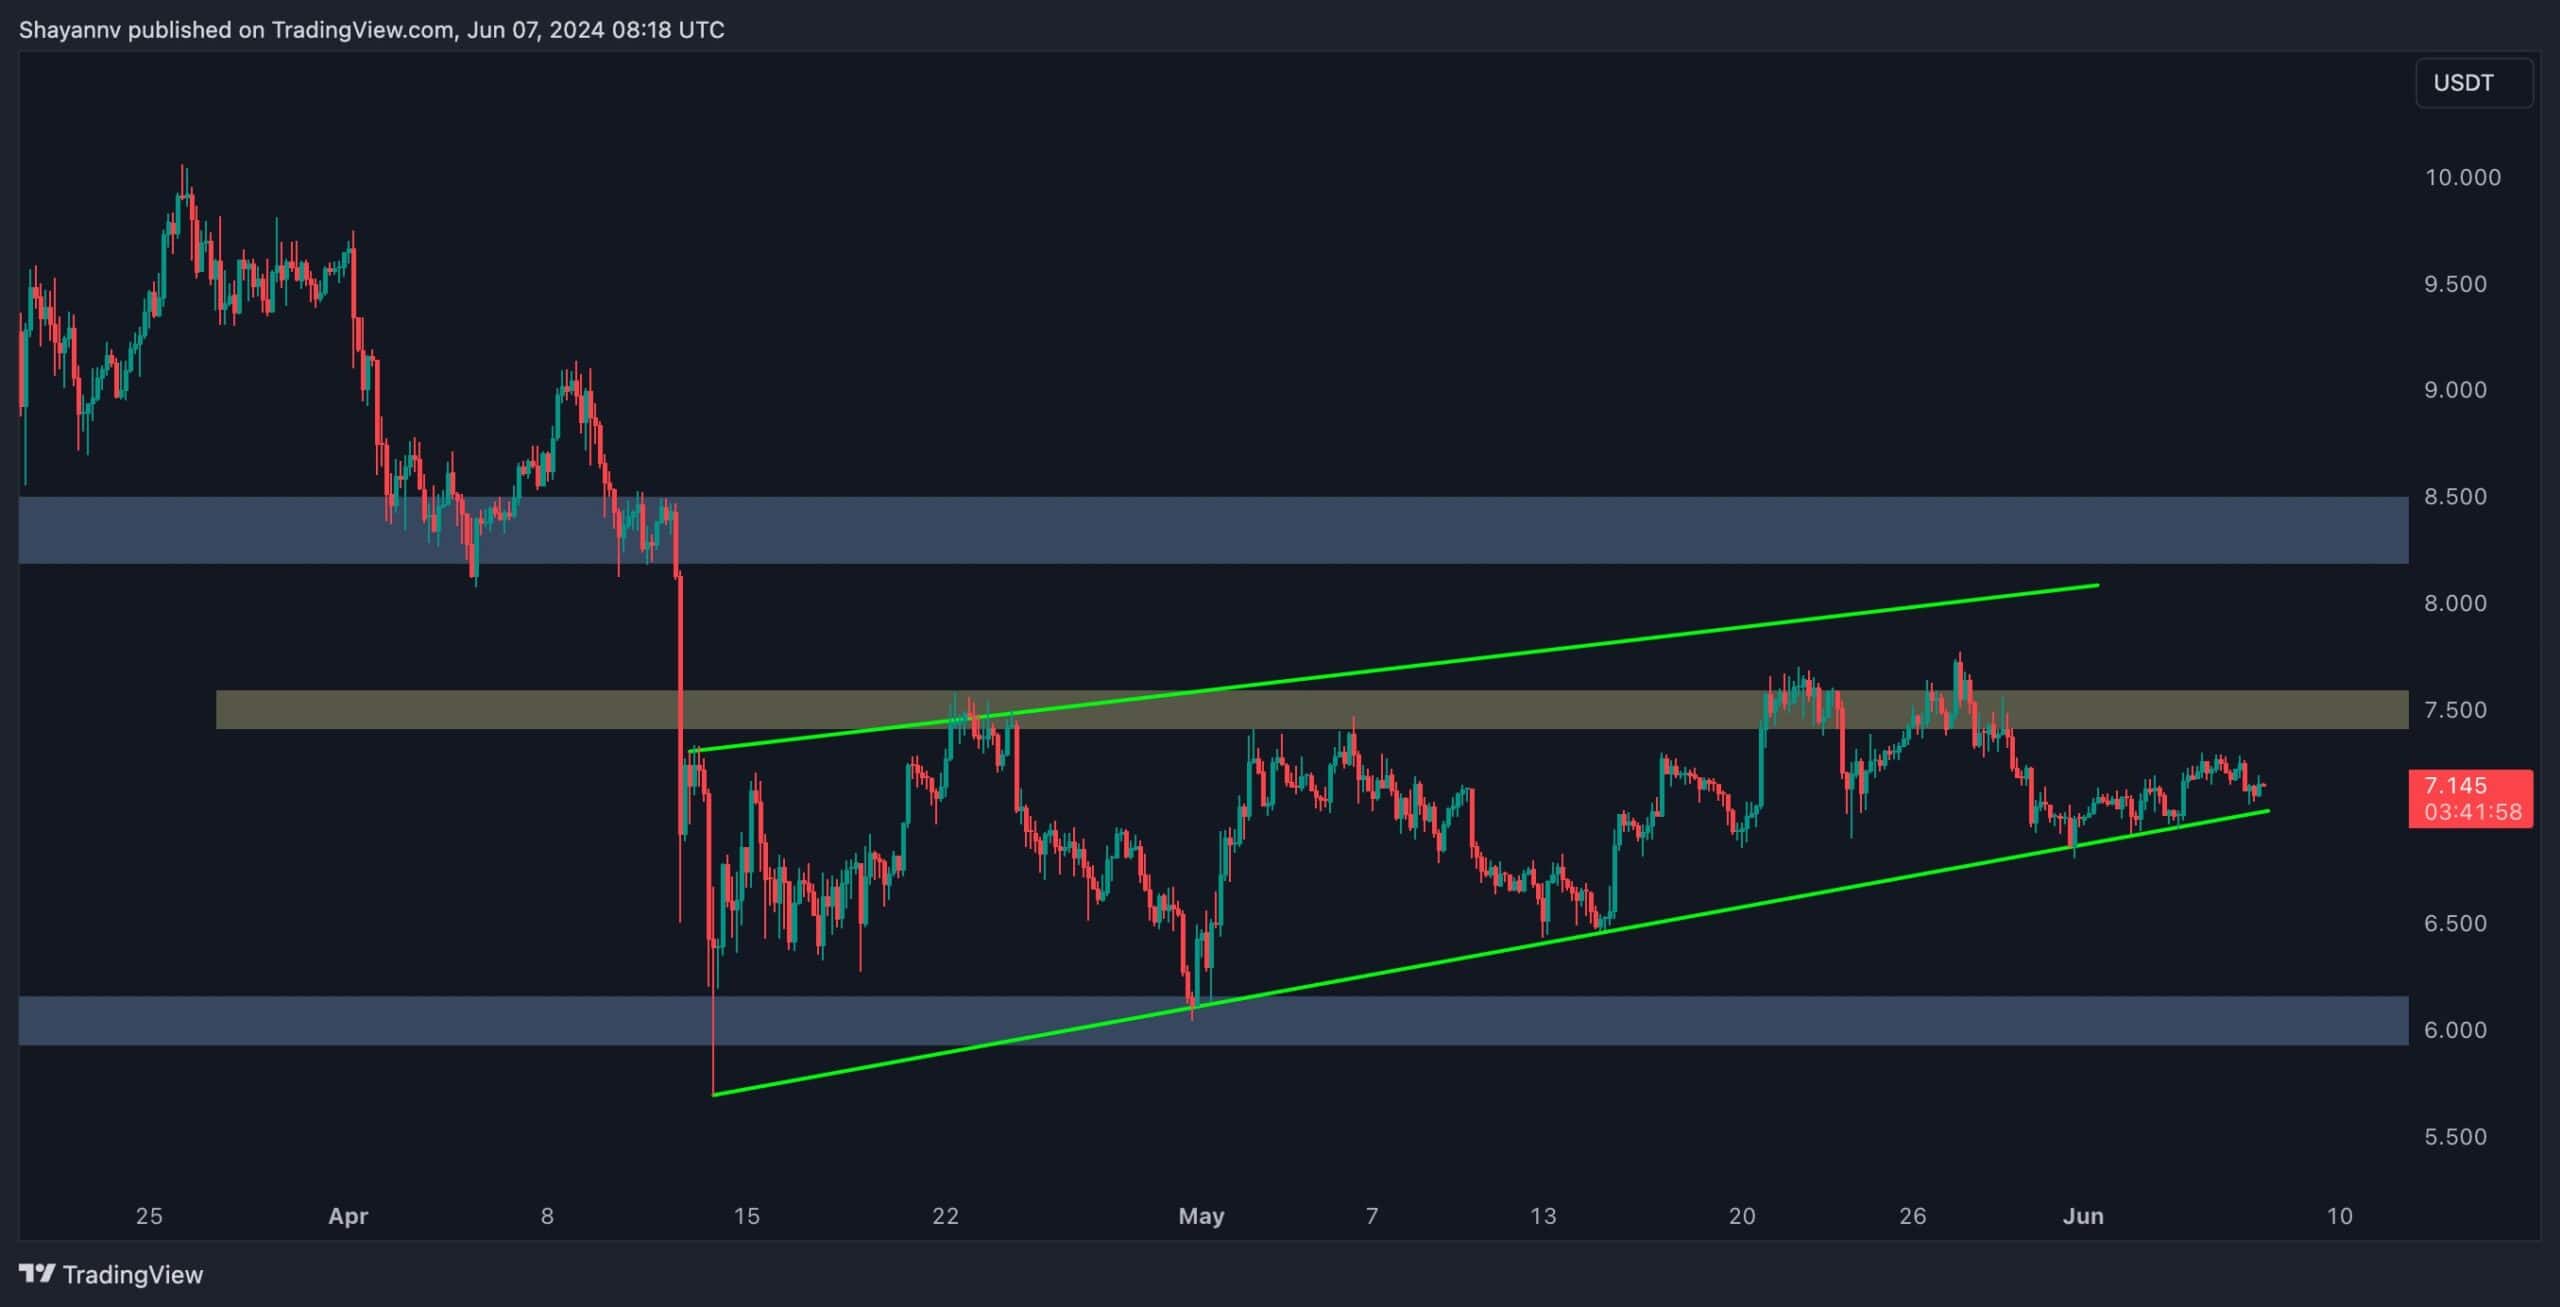
On the 4-hour chart, Polkadot’s price has formed an ascending wedge pattern amid the recent multi-month consolidation phase. This pattern typically indicates a continuation of the initial bearish movement if breached from its lower threshold.
Following a rejection from the significant $7.5 resistance level, the price declined, reaching the pattern’s lower boundary. However, upon reaching this point, the momentum waned, leading to a period of consolidation with minimal volatility. Nonetheless, the price is on the brink of breaking below the pattern’s lower boundary. A valid breakout could trigger a cascade towards the $6.5 mark.
Conversely, continuing the current consolidation phase within the pattern is the most probable scenario, with the price aiming for the wedge’s upper boundary around $8.
Sentiment Analysis
By Shayan
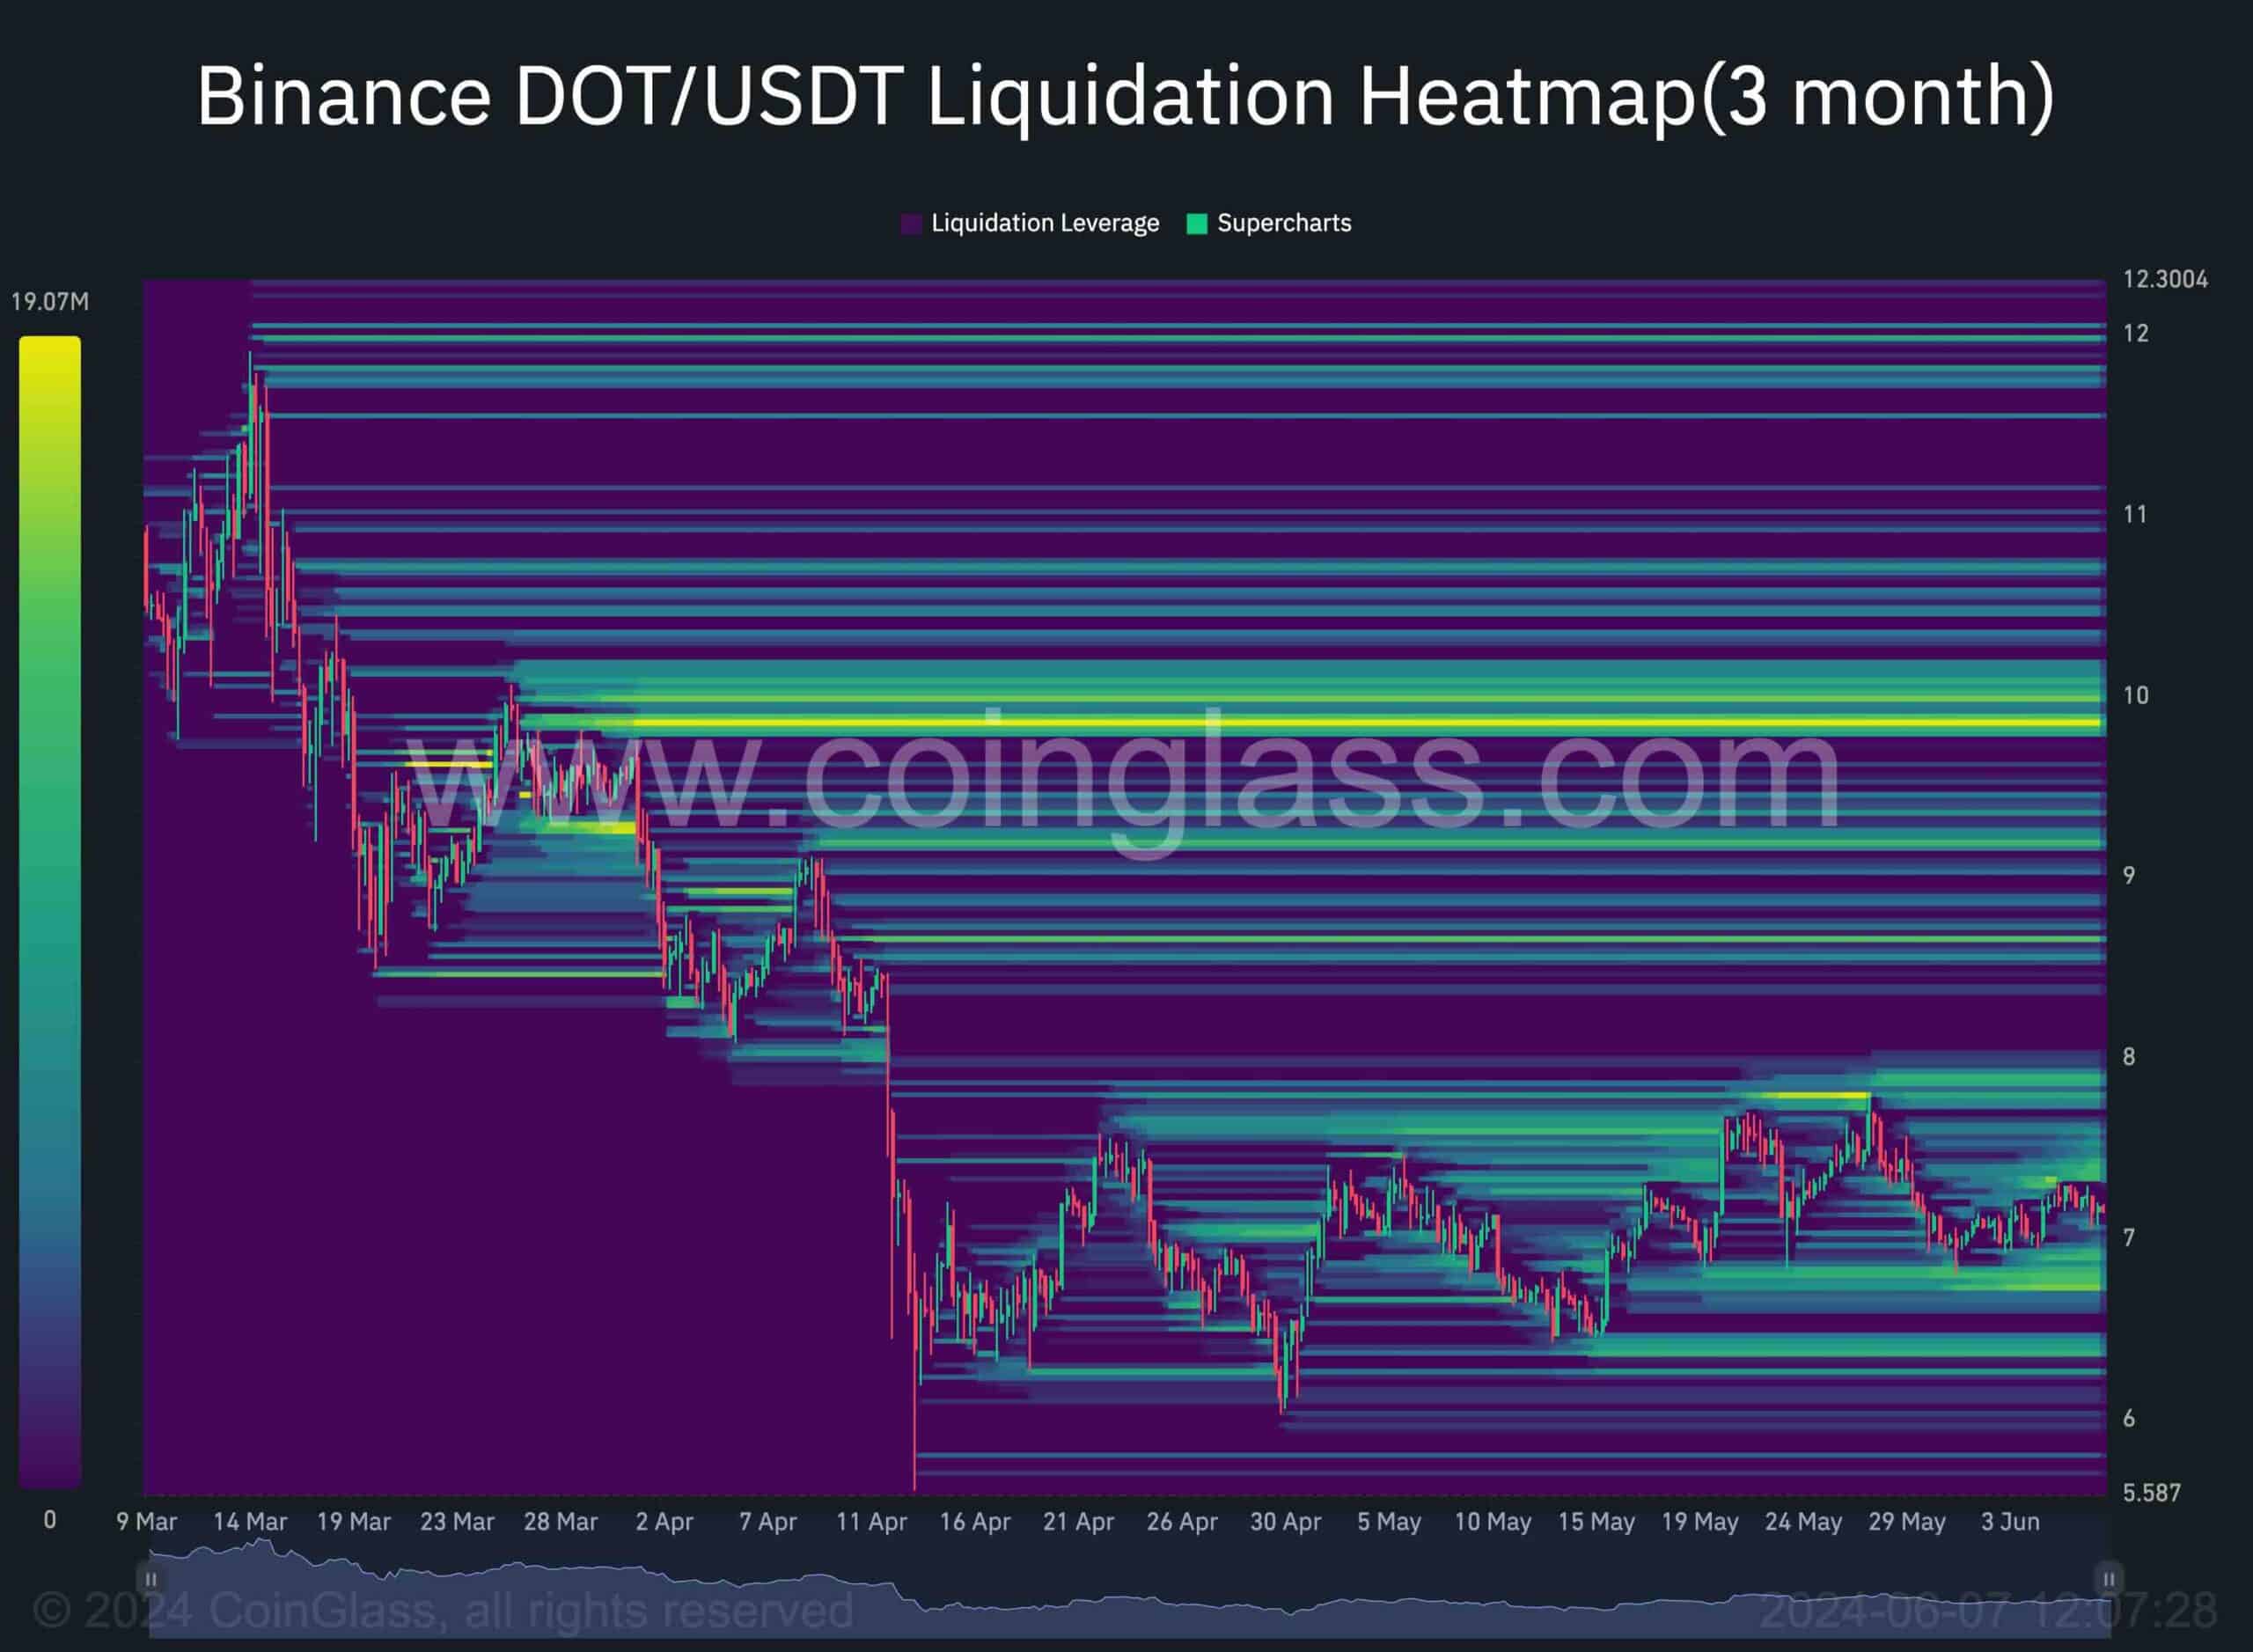
Polkadot is currently experiencing sideways consolidation around the $7 mark. Examining futures market metrics, particularly the DOT/USDT Binance liquidation heatmap, provides valuable insights into potential price movements and liquidity pools.
The heatmap reveals significant liquidity below the $7 level, indicating stop-loss orders and liquidation prices. The $8 area also contains substantial liquidity, acting as a resistance level. If the price approaches this zone, it may face selling pressure from participants looking to realize profits or close positions.
Nevertheless, the $10 zone consists of substantial liquidity, potentially representing the liquidation prices of short positions that drove the initial bearish movement before the current consolidation stage.
Polkadot’s price is trapped between the $7 support and $8 resistance levels, influenced by significant liquidity pools at these zones. A breakout from this range could lead to notable price movements, with the $10 region being a potential mid-term target in case of a bullish revival.
The post Polkadot Can Target $10 Next, but Here’s the Catch (DOT Price Analysis) appeared first on CryptoPotato.