Perfect Settings For Alt-Season 2019? In 2017 It Started Like This
It’s safe to say that the last several days were fairly turbulent for Bitcoin’s price. The cryptocurrency surged from around $8,150 to about $8,800 in a few days and lost all of its gains in a shattering red hourly candle which brought its price back to around $8,300. Now, popular analysts are seeing a resemblance in Bitcoin’s behavior with that in 2017 which led to the most prominent altcoin season we’ve seen yet. Will history repeat itself?
Bitcoin’s Price Performance
Towards the end of last week, we saw Bitcoin’s price jumping from $8,150 to $8,800, seemingly shattering important resistance levels on the way up. However, the enthusiasm was short-lived and rather for not, because it turned out that this is a fake breakout.
Consequently, Bitcoin’s price pulled back from $8,800 and it dropped to around $8,300. Interestingly enough, this happened in just one devastating hourly candle.
Since then, the action has stagnated and Bitcoin trades in a narrow range with a few exceptions.
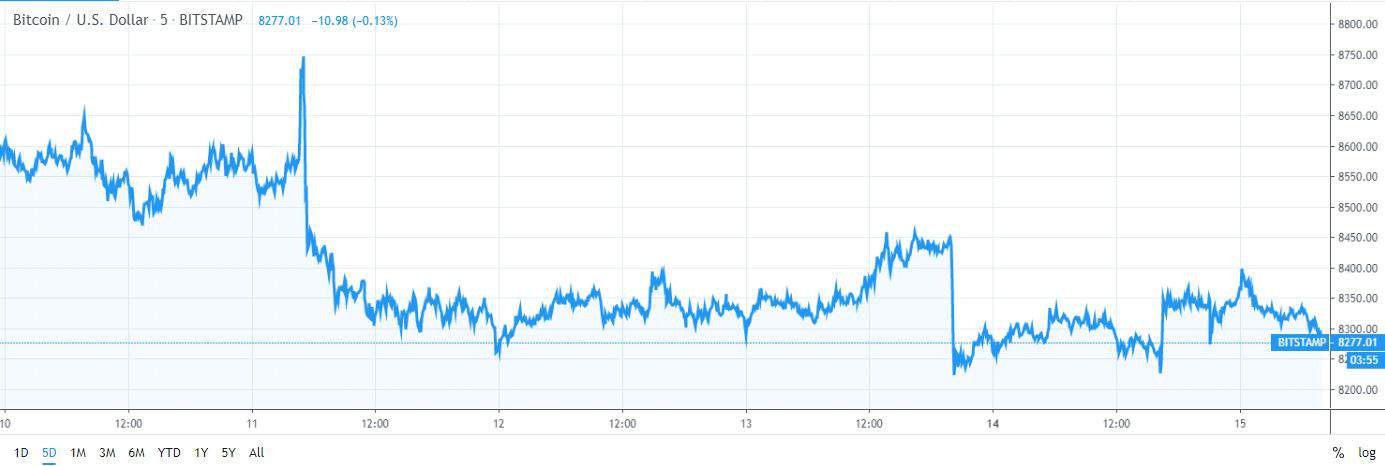
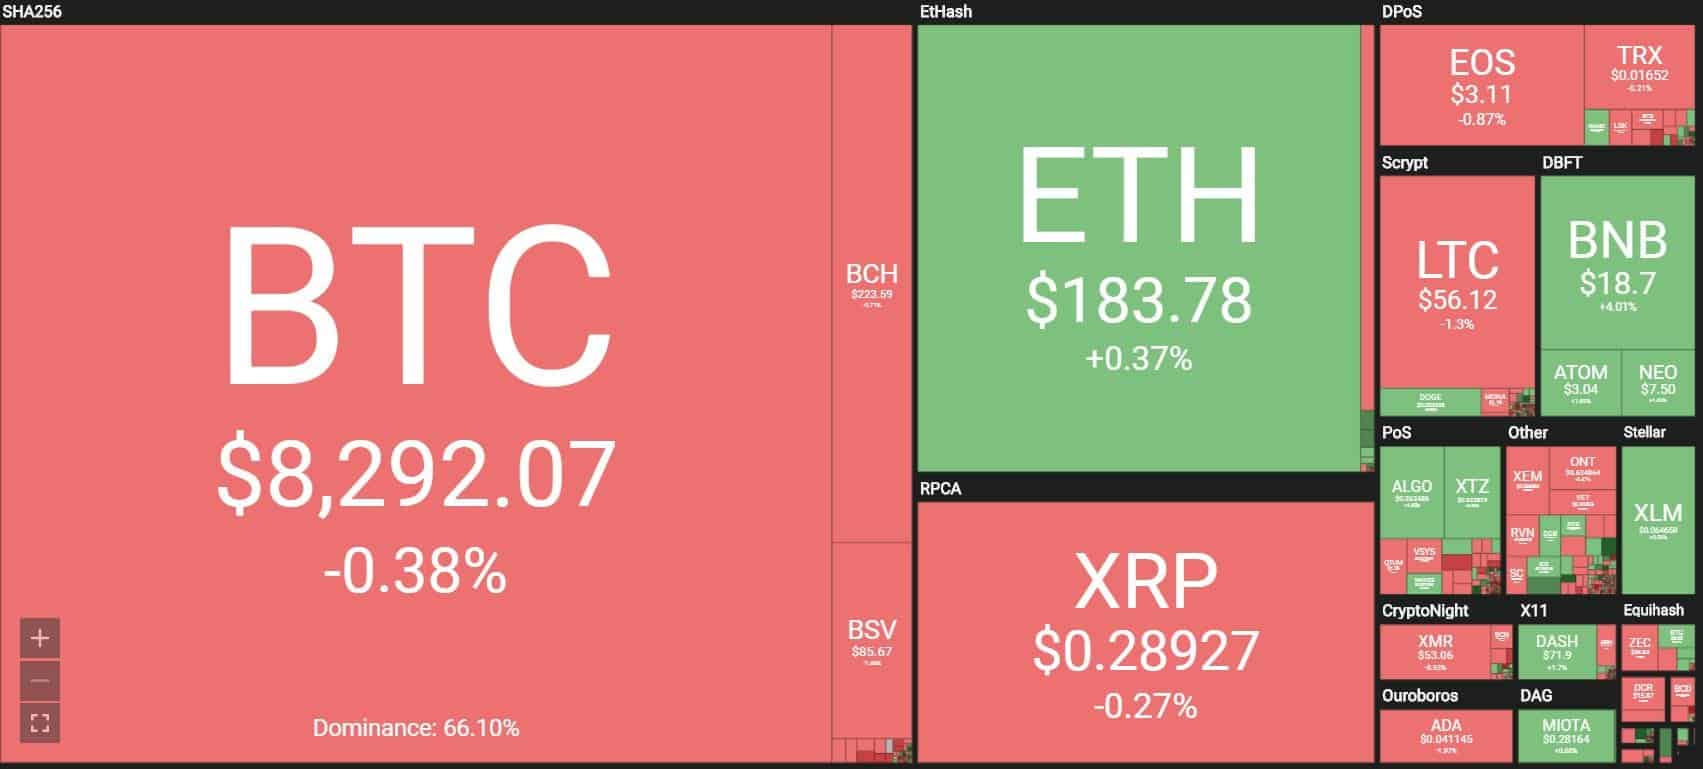
At the time of this writing, Bitcoin is trading at around $8,280 and holds a market cap of $150 billion Bitcoin’s dominance index has also been suffering over the past couple of weeks, as it’s now 66.4%.
Altcoin Season In Sight?
Past performance shouldn’t be taken as an indicator of future growth. However, it is absolutely imperative to consider historical data when identifying key moments in Bitcoin’s price and in the movement of different altcoins.
A popular cryptocurrency trader has just brought up a comparison between the performance of Bitcoin and altcoins now and back in 2017.
He says that the 2017 altcoin season began right after the first big dip on Bitcoin from $1,300 to $900.
In 2017 altseason began after the first big dip on btc from $1300 to $900.
The scenario looks pretty similar right now. pic.twitter.com/W3qJ8HSXFJ
— Crypto₿ull (@CryptoBull) October 14, 2019
We can see some similarities in the charts. It’s important to note that 2017’s parabolic run was unparalleled and it brought the prices for different cryptocurrencies to their all-time highs which, for the most part, haven’t been reached ever since.
Another trader also pointed out that there are other similarities such as this which should probably be considered. In January 2016, he said that the same thing happened and it gave merit for another bull market. According to him, Bitcoin finding its bottom and starting to grind up slowly is “always the best environment for altcoins.”
Meanwhile, altcoins appear to be in a mixed trend. Some are marking slight gains and others are down a bit. For the most part, however, they also appear to be trading in a range, which could suggest that a big move is on the horizon.
The post Perfect Settings For Alt-Season 2019? In 2017 It Started Like This appeared first on CryptoPotato.


