PEPE Nosedives 15% in 7 Days But is a Huge Move Incoming? (PEPE Coin Price Analysis)
PEPE’s volatility exploded in the past few days, with the price moving by over 30% in a day.
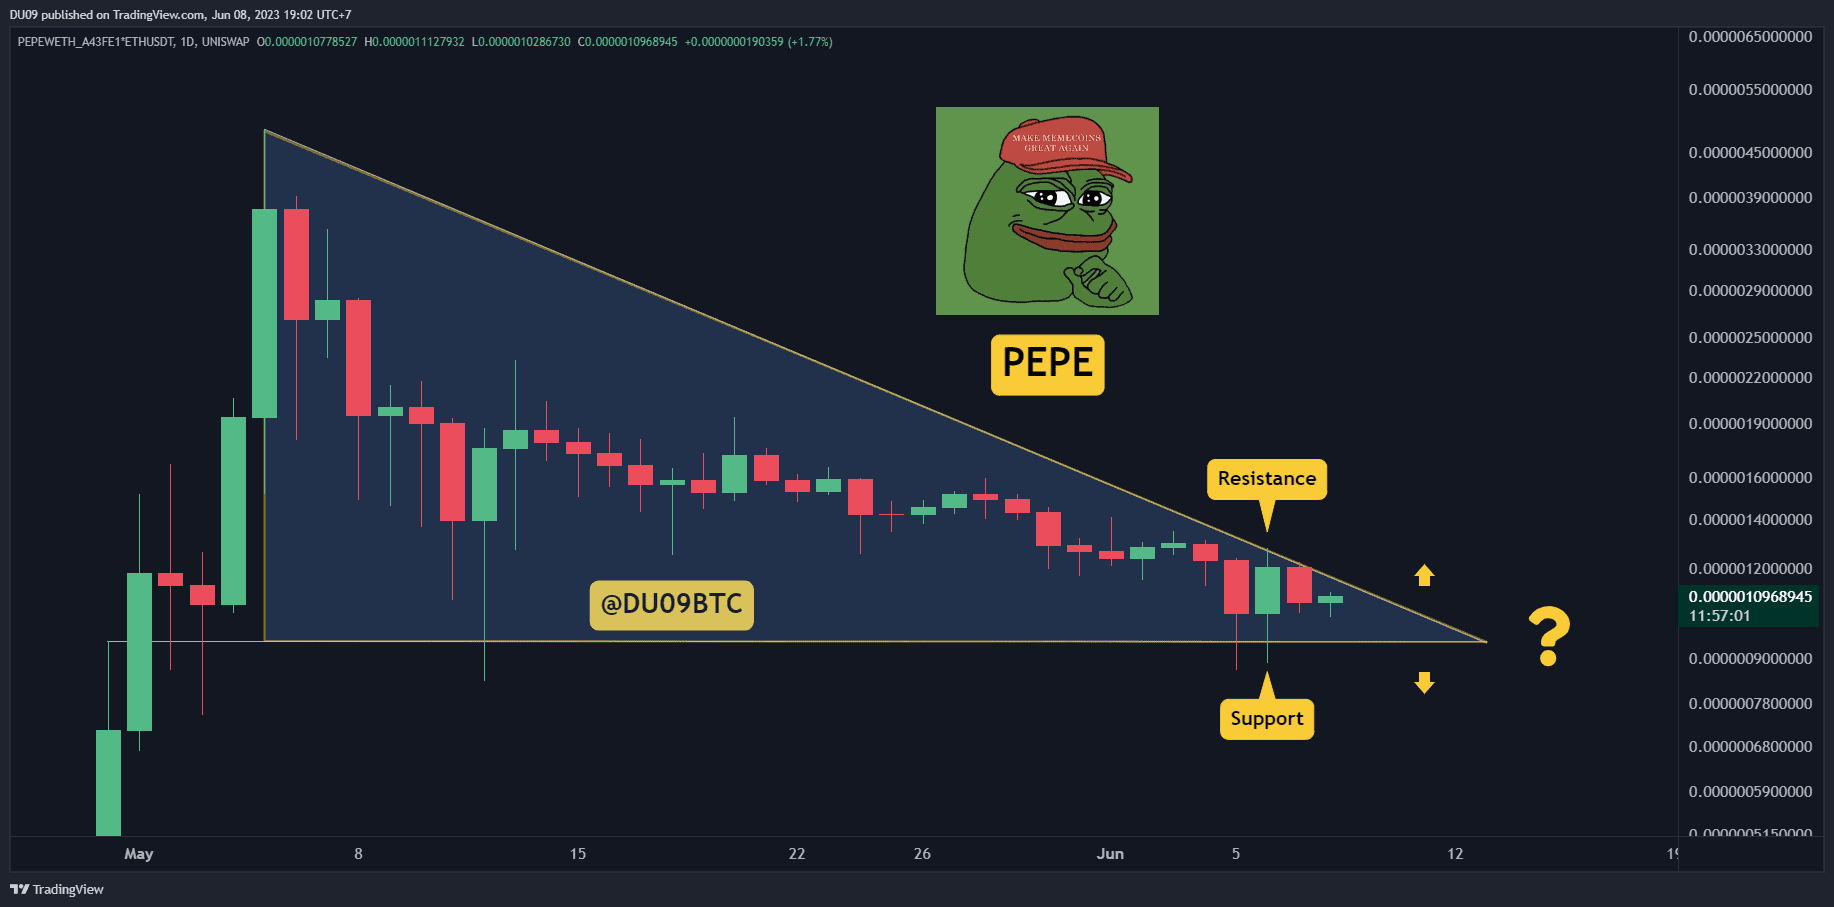
Key Support levels: $0.0000013
Key Resistance levels: $0.0000010
After a long period of low volatility, PEPE’s price action changed on Monday when the SEC sued Binance. The price quickly moved up and down by over 30% and, in the process, made a new low. This has created a large descending triangle which could be interpreted as bearish.
The current support is at $0.0000010, and the resistance is at $0.0000013. With the price quickly approaching the apex of this formation, PEPE could make a major move in the next few days.
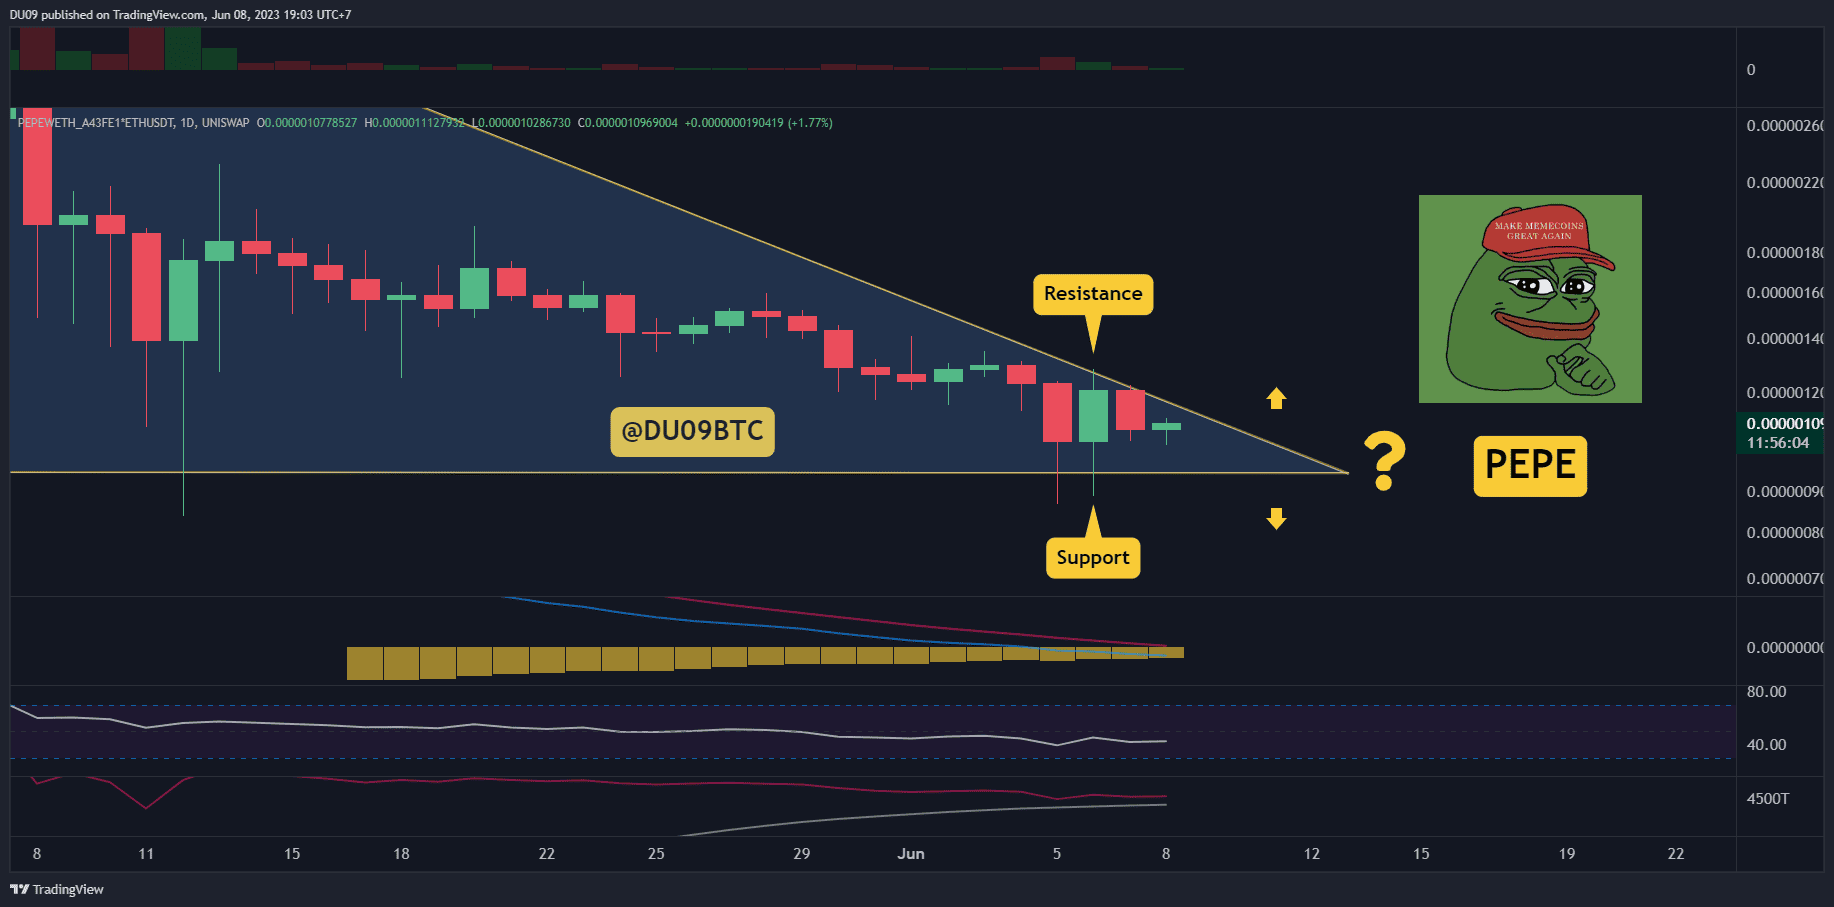
Trading Volume: The volume picked up on Monday, with bears dominating the chart.
RSI: The daily RSI is under 50 points and continues to give a bearish bias due to it making lower highs.
MACD: The daily MACD is negative. However, the histogram is making higher lows which could signal that this downtrend may find a bottom in the near future.
Bias
The bias for PEPE is bearish.
Short-Term Prediction for PEPE Price
It’s likely that the volatility to be high in the next few days, with a breakout from this triangle appearing imminent. Buyers have to do all they can to defend the key support at $0.0000010. Any failure there would open the way for PEPE to fall much lower and towards $0.0000005.
The post PEPE Nosedives 15% in 7 Days But is a Huge Move Incoming? (PEPE Coin Price Analysis) appeared first on CryptoPotato.