PEPE Crashes 10% Daily: Time for a Bounce or More Pain Ahead? (PEPE Price Analysis)
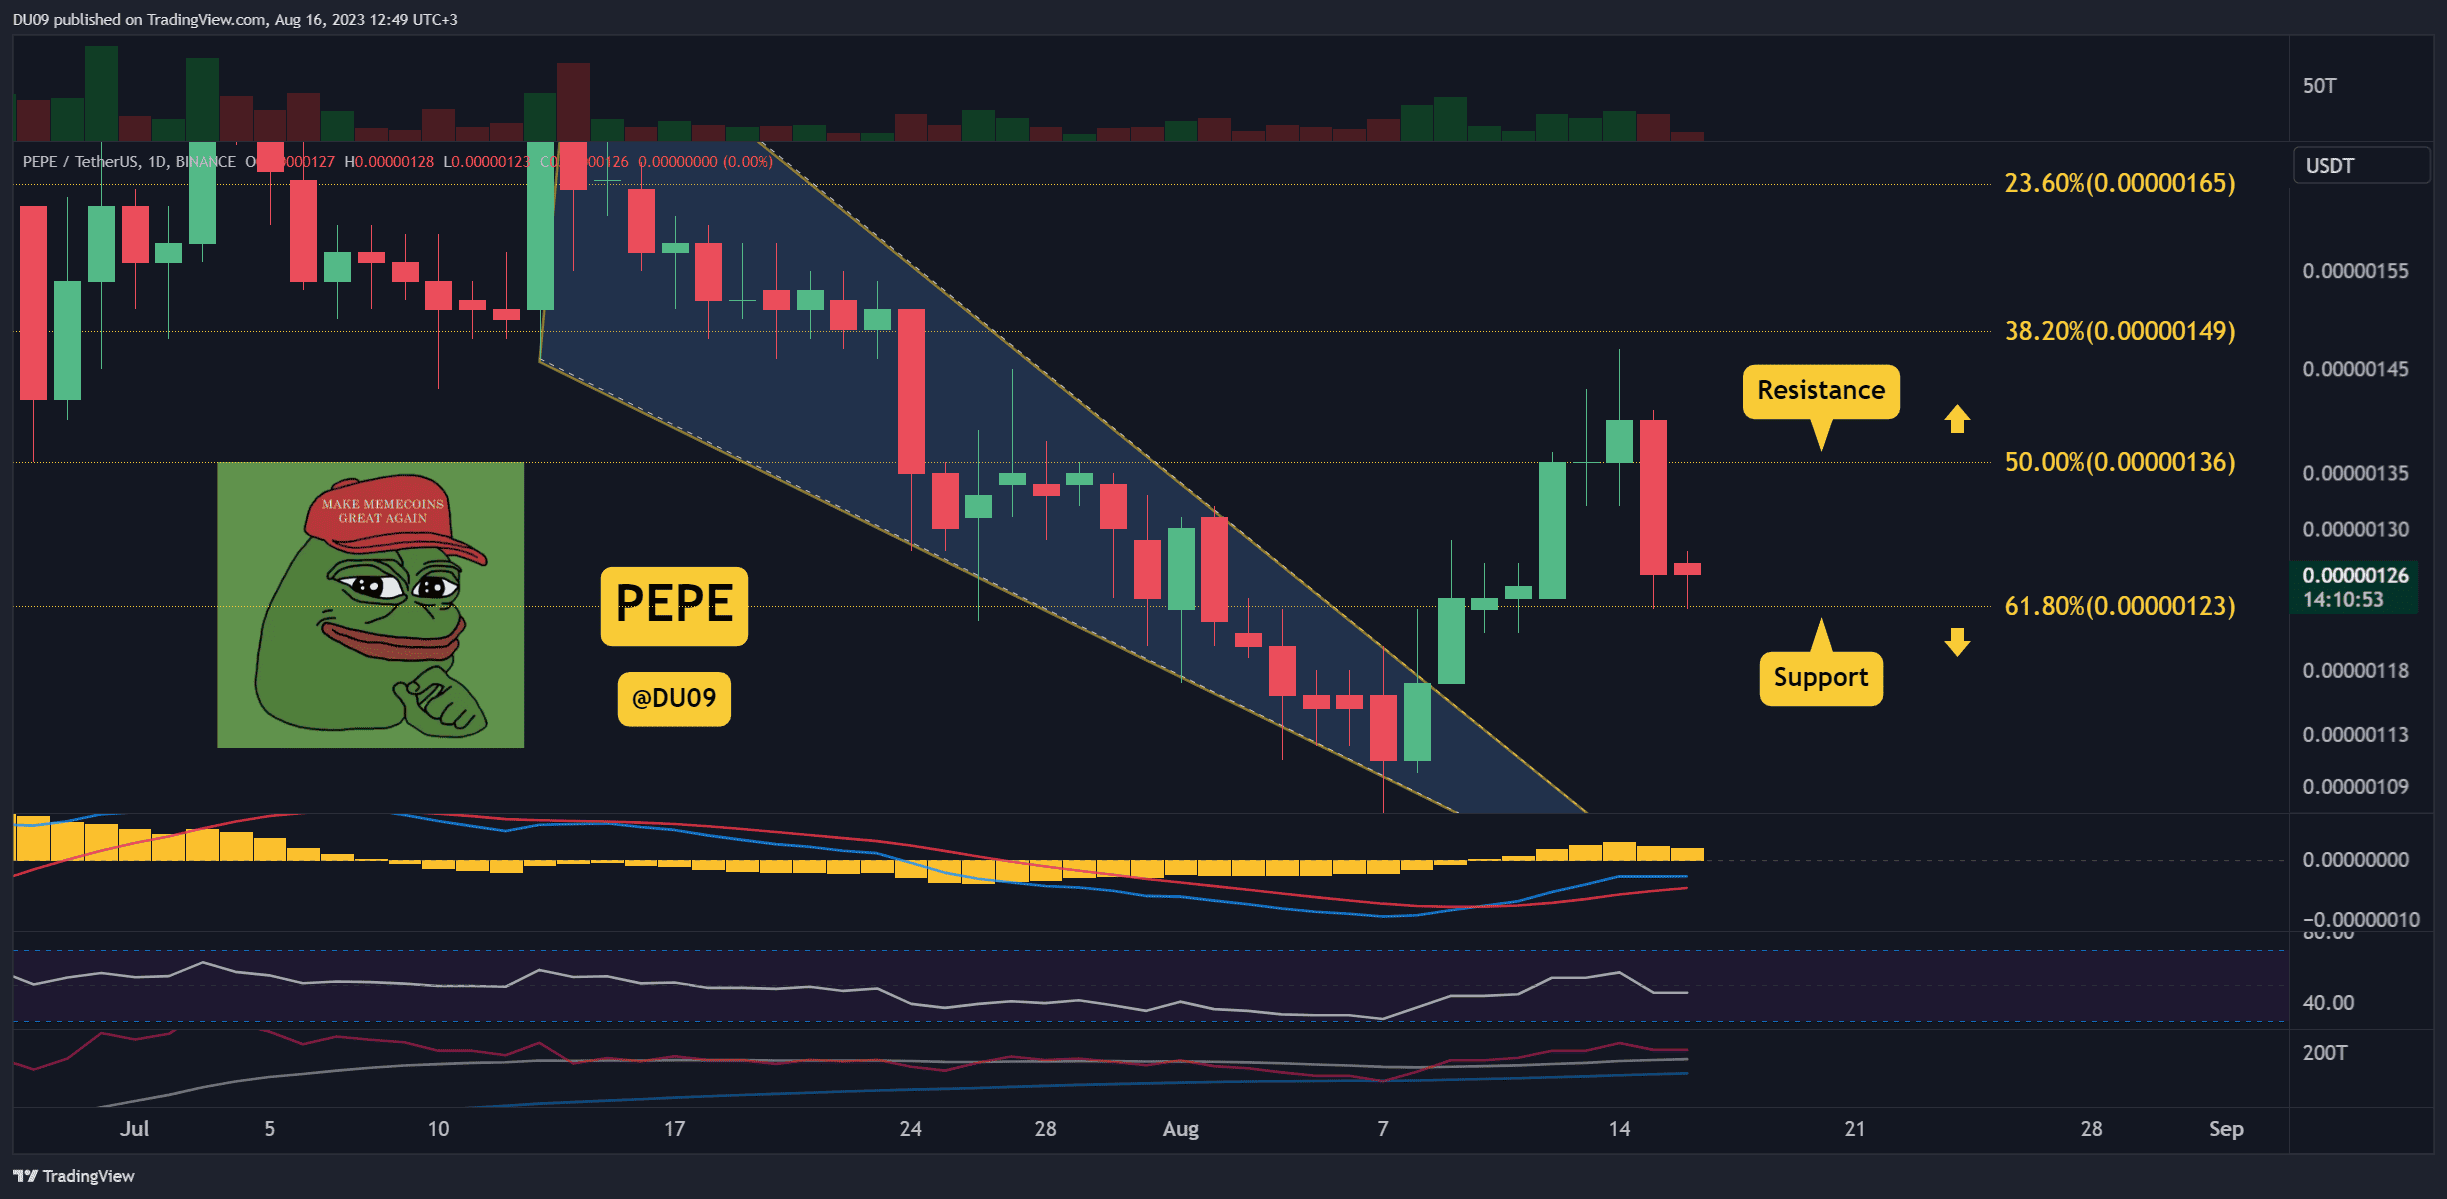
PEPE finally found its resistance and the price crashed by 10% in a day.
Key Support levels: $0.00000123
Key Resistance levels: $0.00000136
1. Price at Critical Support
With the rally over, PEPE has found good support at $0.00000123. However, sellers have control of the price action right now and may not be satisfied yet. Further volatility seems likely as pressure builds at this key level.
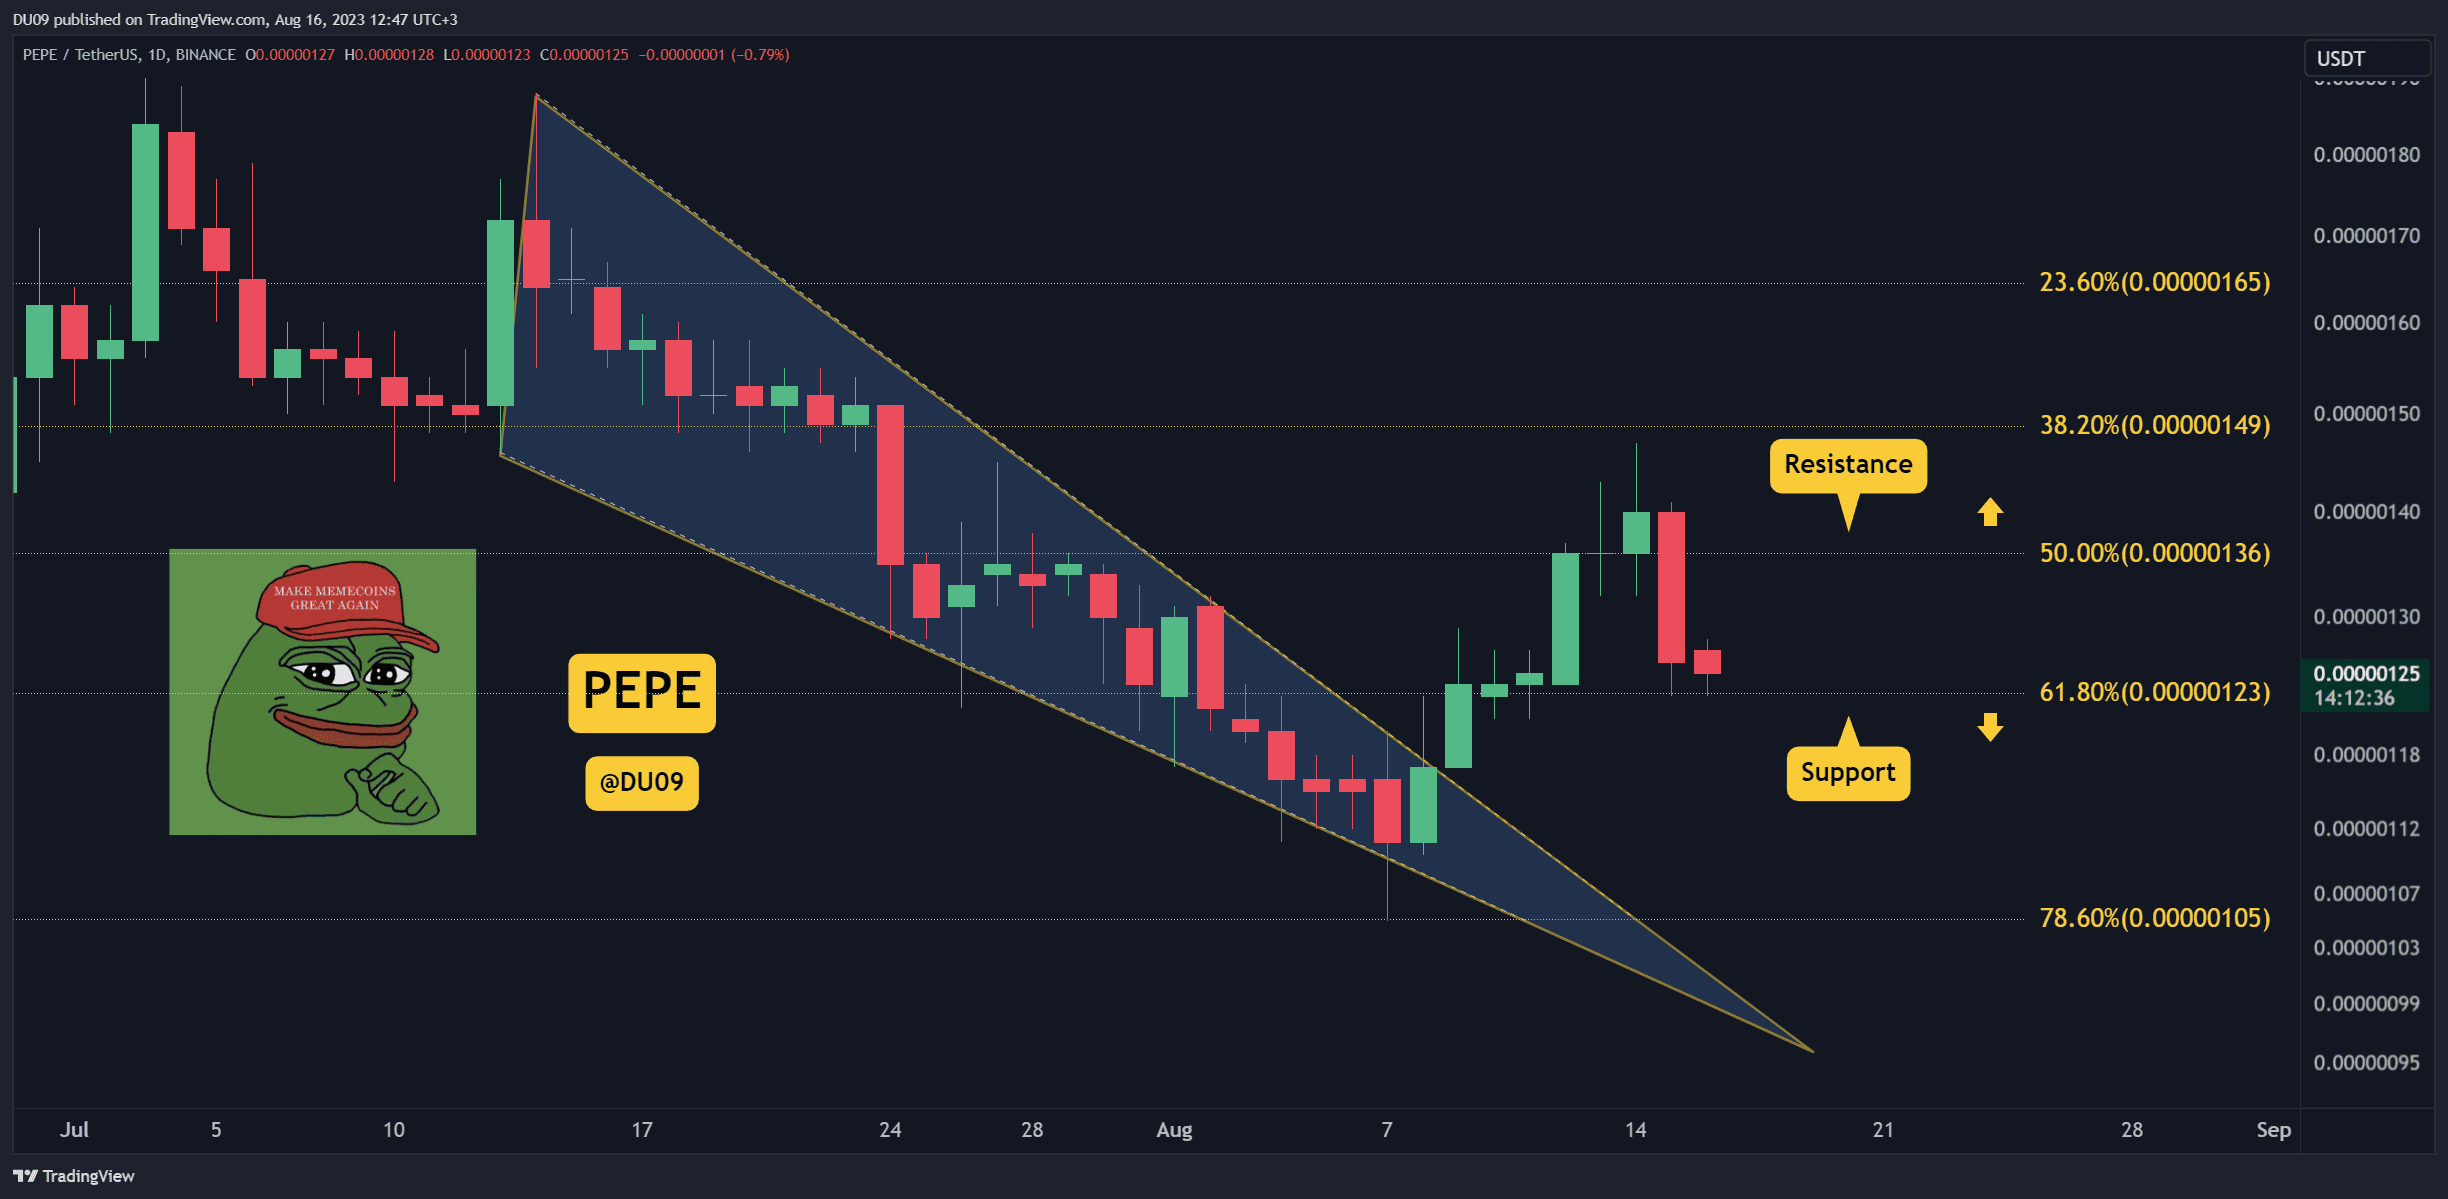
2. Sellers Return in Force
Over the past two days, the selling pressure intensified and changed the dynamics in the market, which could turn the price action bearish if sellers break below the current support.
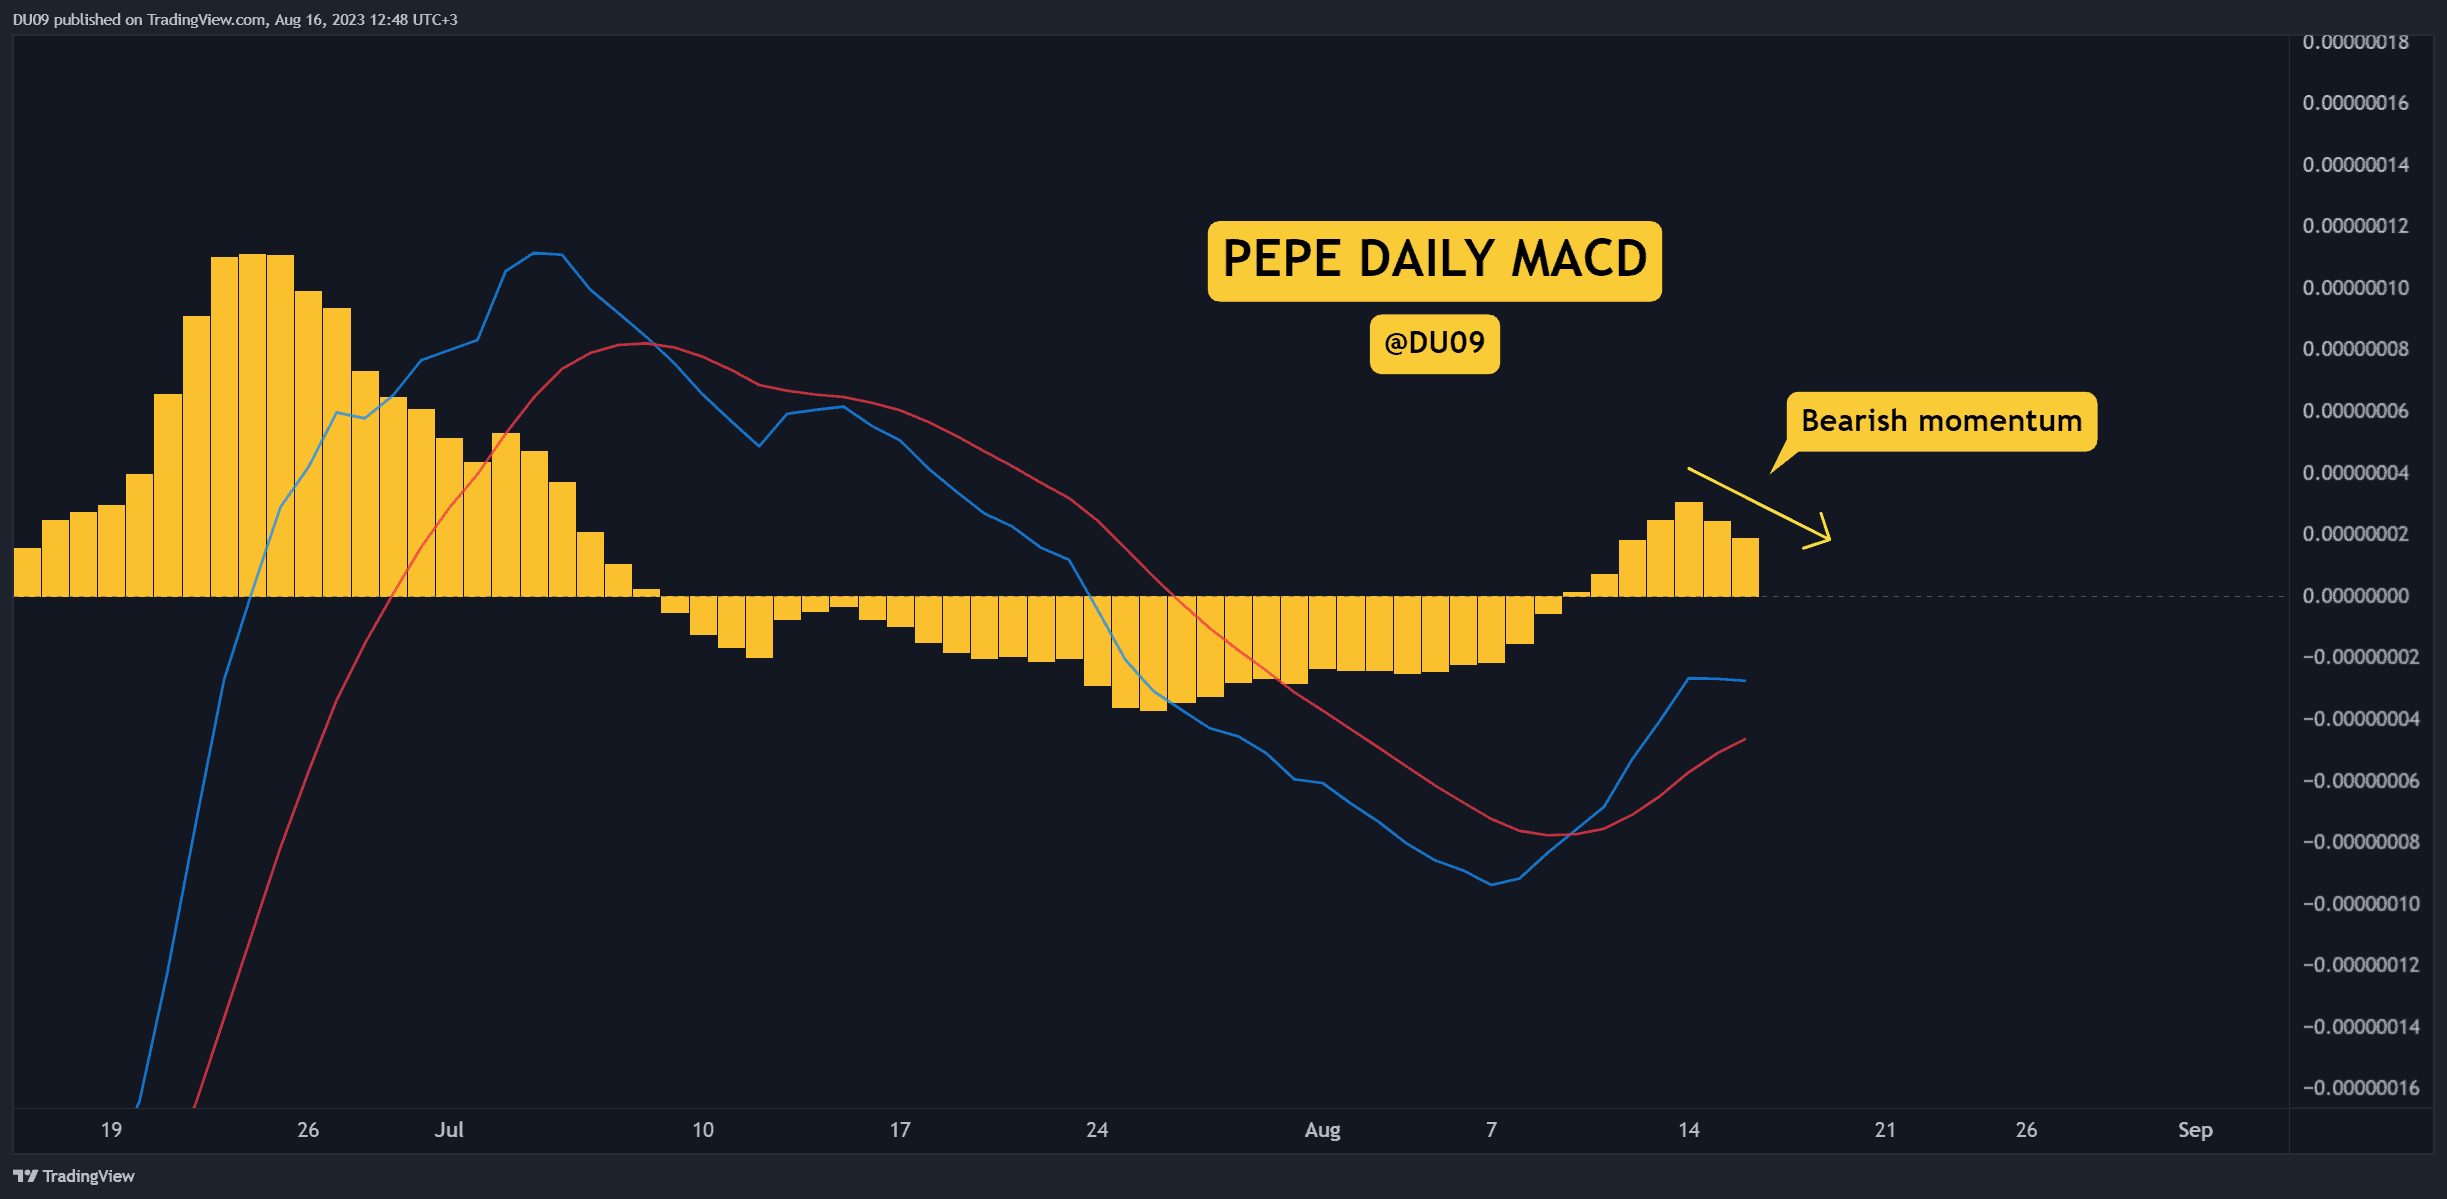
3. Bearish Momentum
PEPE’s momentum shifted gears in one day. This shows that memecoins are a high-risk bet as their volatility and direction can change suddenly based on market sentiment. If bulls can’t defend the current support, the bearish momentum will be more likely to intensify.
Bias
The bias for PEPE is bearish.
Short-Term Prediction for PEPE Price
As long as the key support at $0.00000123 holds, buyers still have a chance to stop sellers and take over. If they fail, then look for levels around $0.00000116 might come in play before PEPE can find its footing again.
The post PEPE Crashes 10% Daily: Time for a Bounce or More Pain Ahead? (PEPE Price Analysis) appeared first on CryptoPotato.