People Don’t Touch Their BTC: Supply Last Active 5 Years Ago Now at 30%
The cryptocurrency data intelligence provider Glassnode estimated that approximately 29.14% of bitcoin’s circulating supply was last active five or more years ago.
The total amount of the primary digital asset mined until now equals around 19.45M BTC, meaning that 5.67M BTC have stayed dormant since 2017 or longer time ago.
- According to Glassnode’s figures, more and more long-term holders prefer to leave their bitcoin stash untouched instead of transferring or cashing it out. BTC Percent Supply, last active over five years ago, has recently reached an all-time high of almost 30%, with the share significantly rising in the past several months.
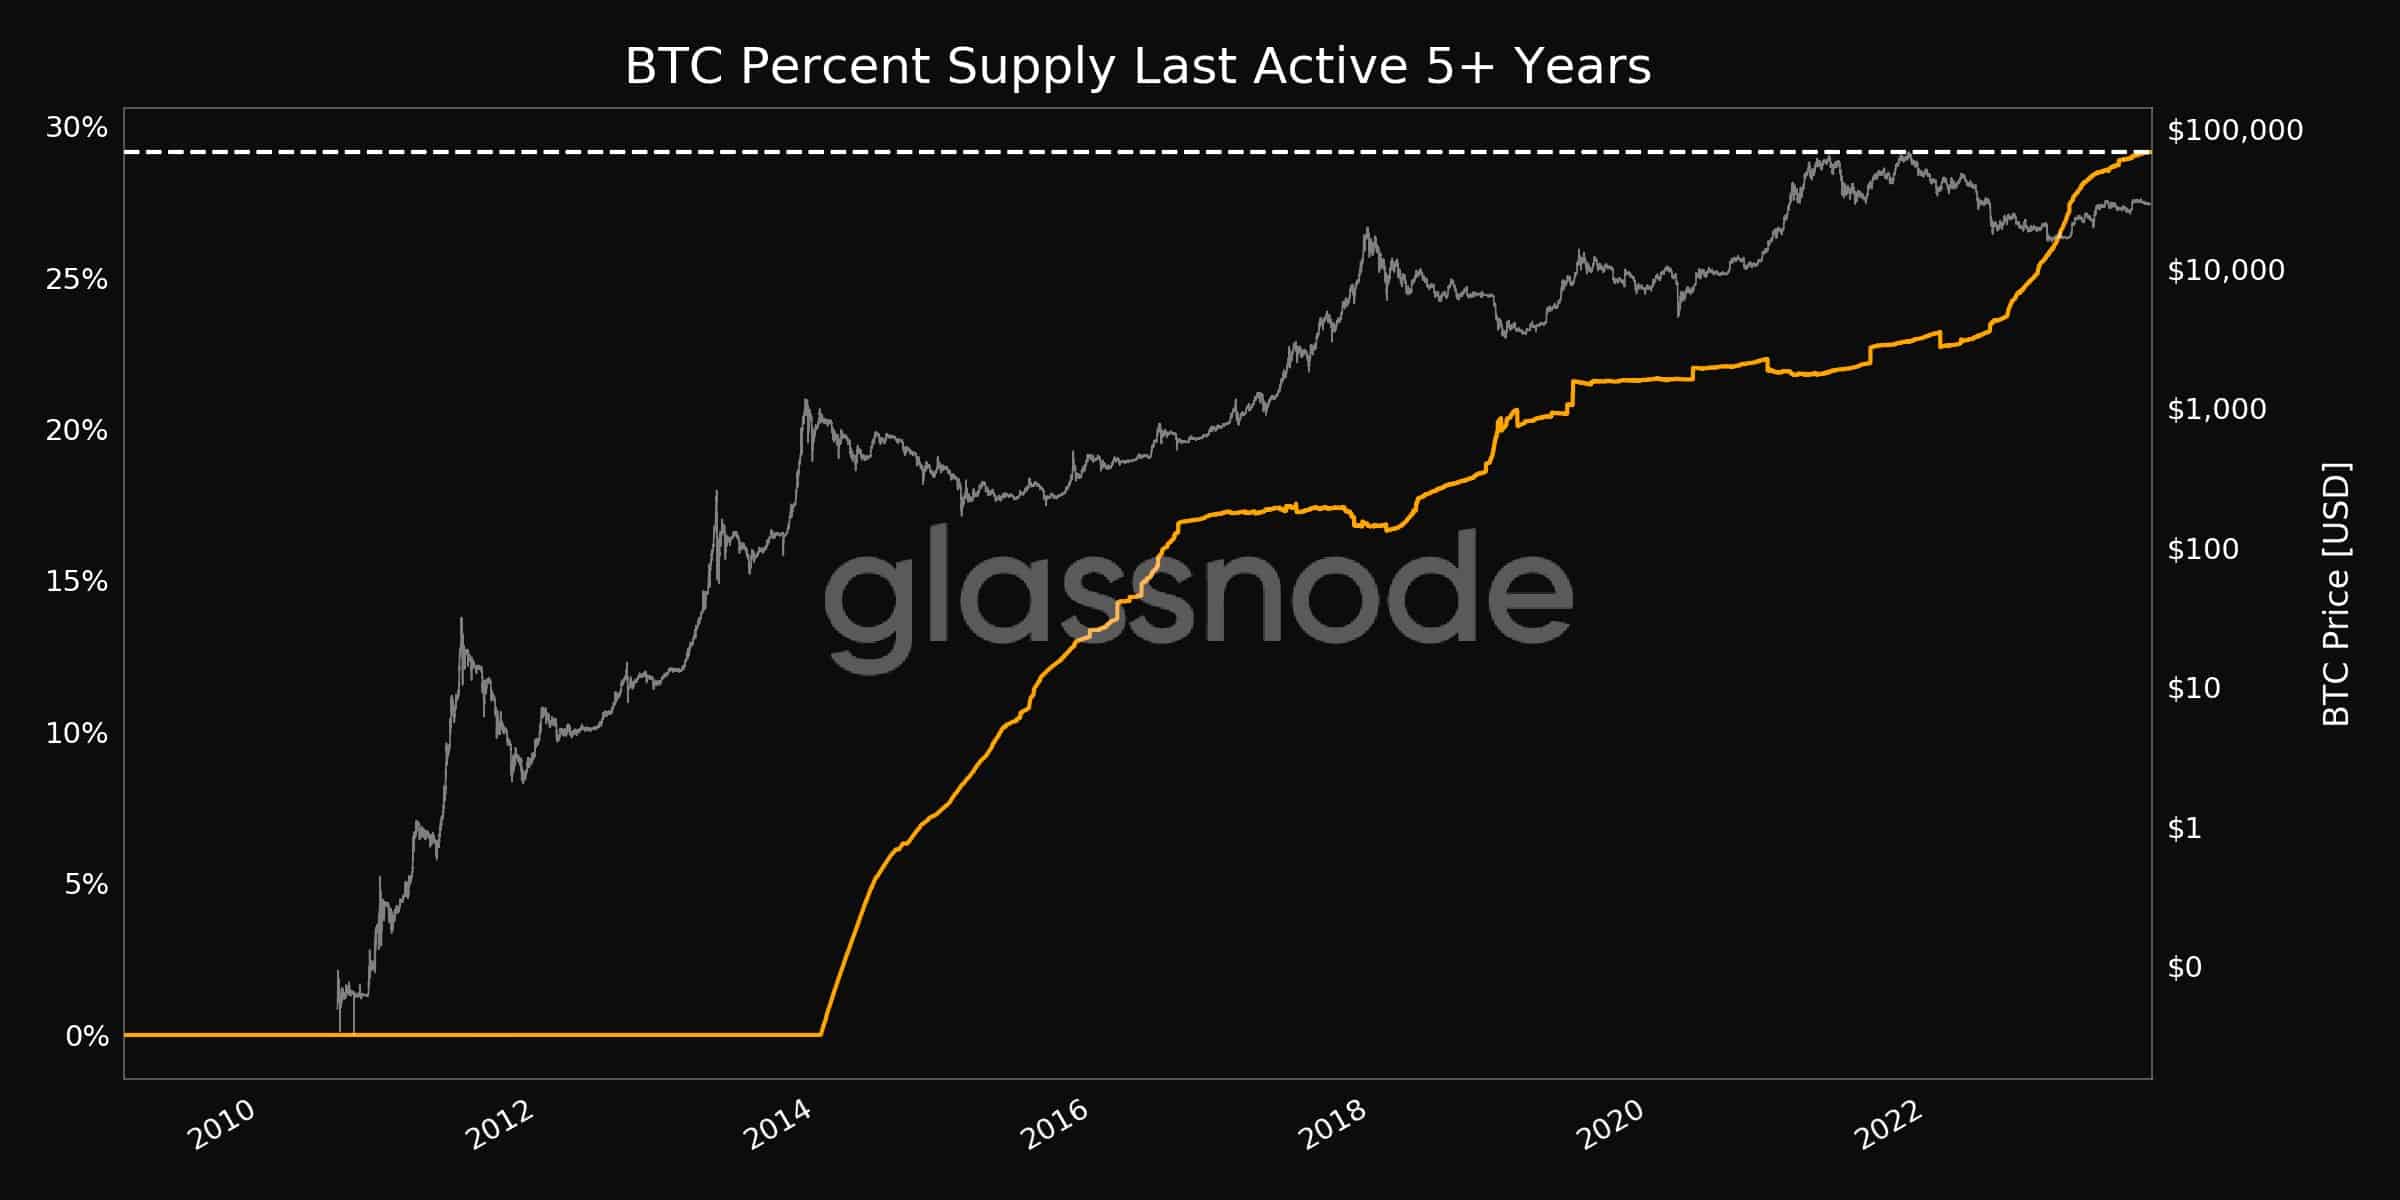
BTC Percent Supply Last Active 5+ Years, Source: Glassnode - As observed on the chart, there were a few occasions when that percentage was spiking whenever bitcoin’s price stagnated for a continuous period of time.
- BTC’s relatively low volatility in the past few months and consolidation at around $29,000 could be one reason why that share had hit an ATH.
- The percent of supply last active five years ago was slightly above 20% at the start of 2022 and a mere 10% in 2016.
- Separately, Glassnode revealed that the number of Bitcoin addresses holding over 1 BTC has also tapped an ATH. Currently, there are 1,012,954 such wallets, a tiny increase compared to the previous peak registered on August 3.
The post People Don’t Touch Their BTC: Supply Last Active 5 Years Ago Now at 30% appeared first on CryptoPotato.