Near Protocol Price Analysis: NEAR Rallies 20% Defying the Overall Market
Key Support levels: $13
Key Resistance levels: $18
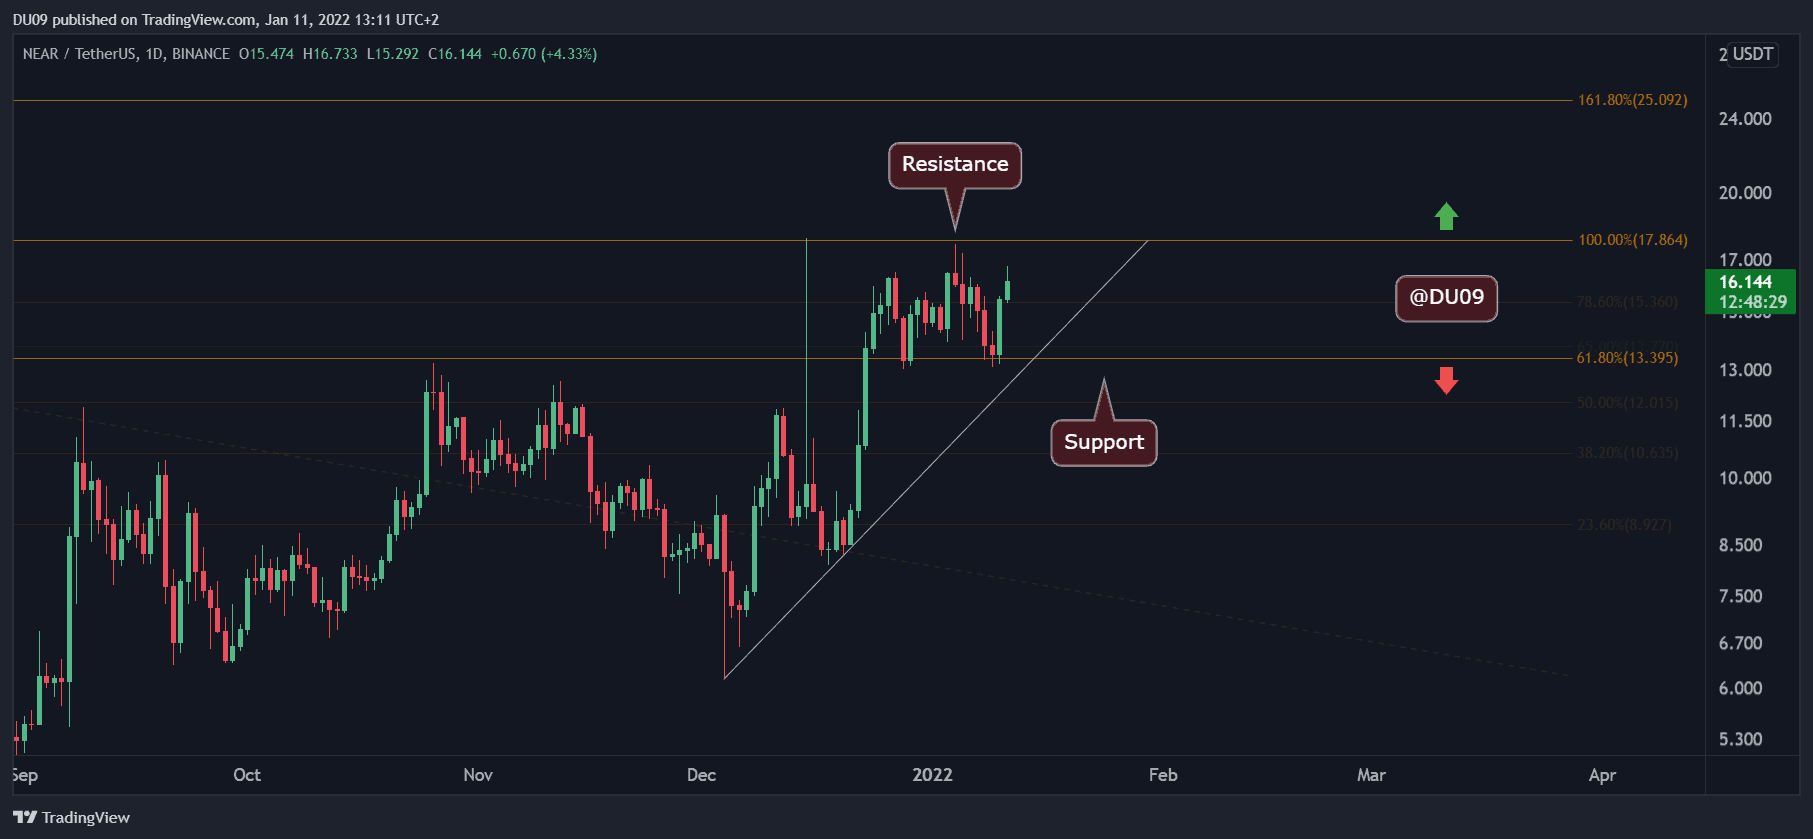
NEAR has managed to make significant gains, reaching almost $18 on January 4 while most of the crypto market was going through a downtrend. Since then, the price has retested successfully the $13 support level, and NEAR appears ready to attempt a new all-time high after reaching $16 today.
So far, the resistance at $18 has prevented the cryptocurrency from breaking a new record, but this key level is being put under pressure by the bulls.

Technical Indicators
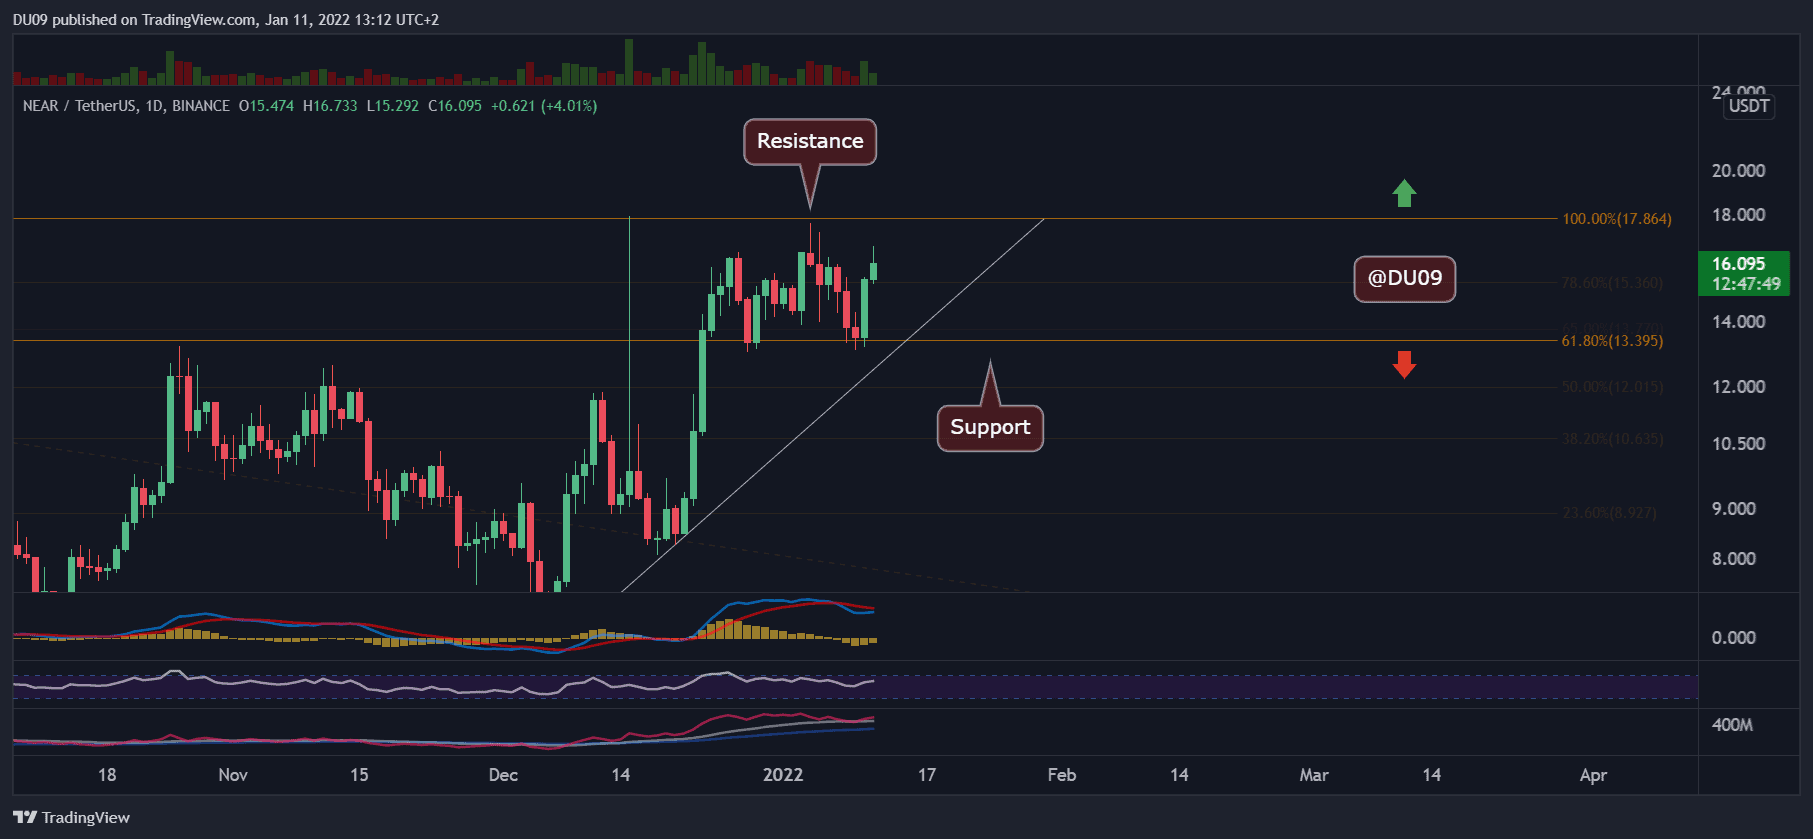
Trading Volume: The strong buy volume in the last two days has pushed NEAR to $16. If this continues, then a test of the key resistance becomes likely.
RSI: The daily RSI is making higher lows and is currently moving up. This is bullish, and only a rejection at the key resistance can stop this momentum.
MACD: The daily MACD completed a bearish cross last week, but this did not prevent NEAR from holding well at the key support. Since then, the MACD moving averages and histogram have been curving back up, indicating a reversal may be at play back towards the bullish side.

Bias
The bias for NEAR is bullish. Despite a difficult start in January, the cryptocurrency has held well, and this is a sign of strength.
Short-Term Price Prediction for NEAR
Considering the current momentum, NEAR appears keen to break the key resistance at $18. If successful, then it will enter price discovery, and it’s anyone’s guess what would happen after that.


