More Troubles Ahead for ETH Following the Failure at $2K? (Ethereum Price Analysis)
Ethereum’s price has once again failed to break above the psychological resistance level of $2,000. While the PA has been bearish over the past few days, there is hope that the market might rebound soon.
Technical Analysis
By: Edris
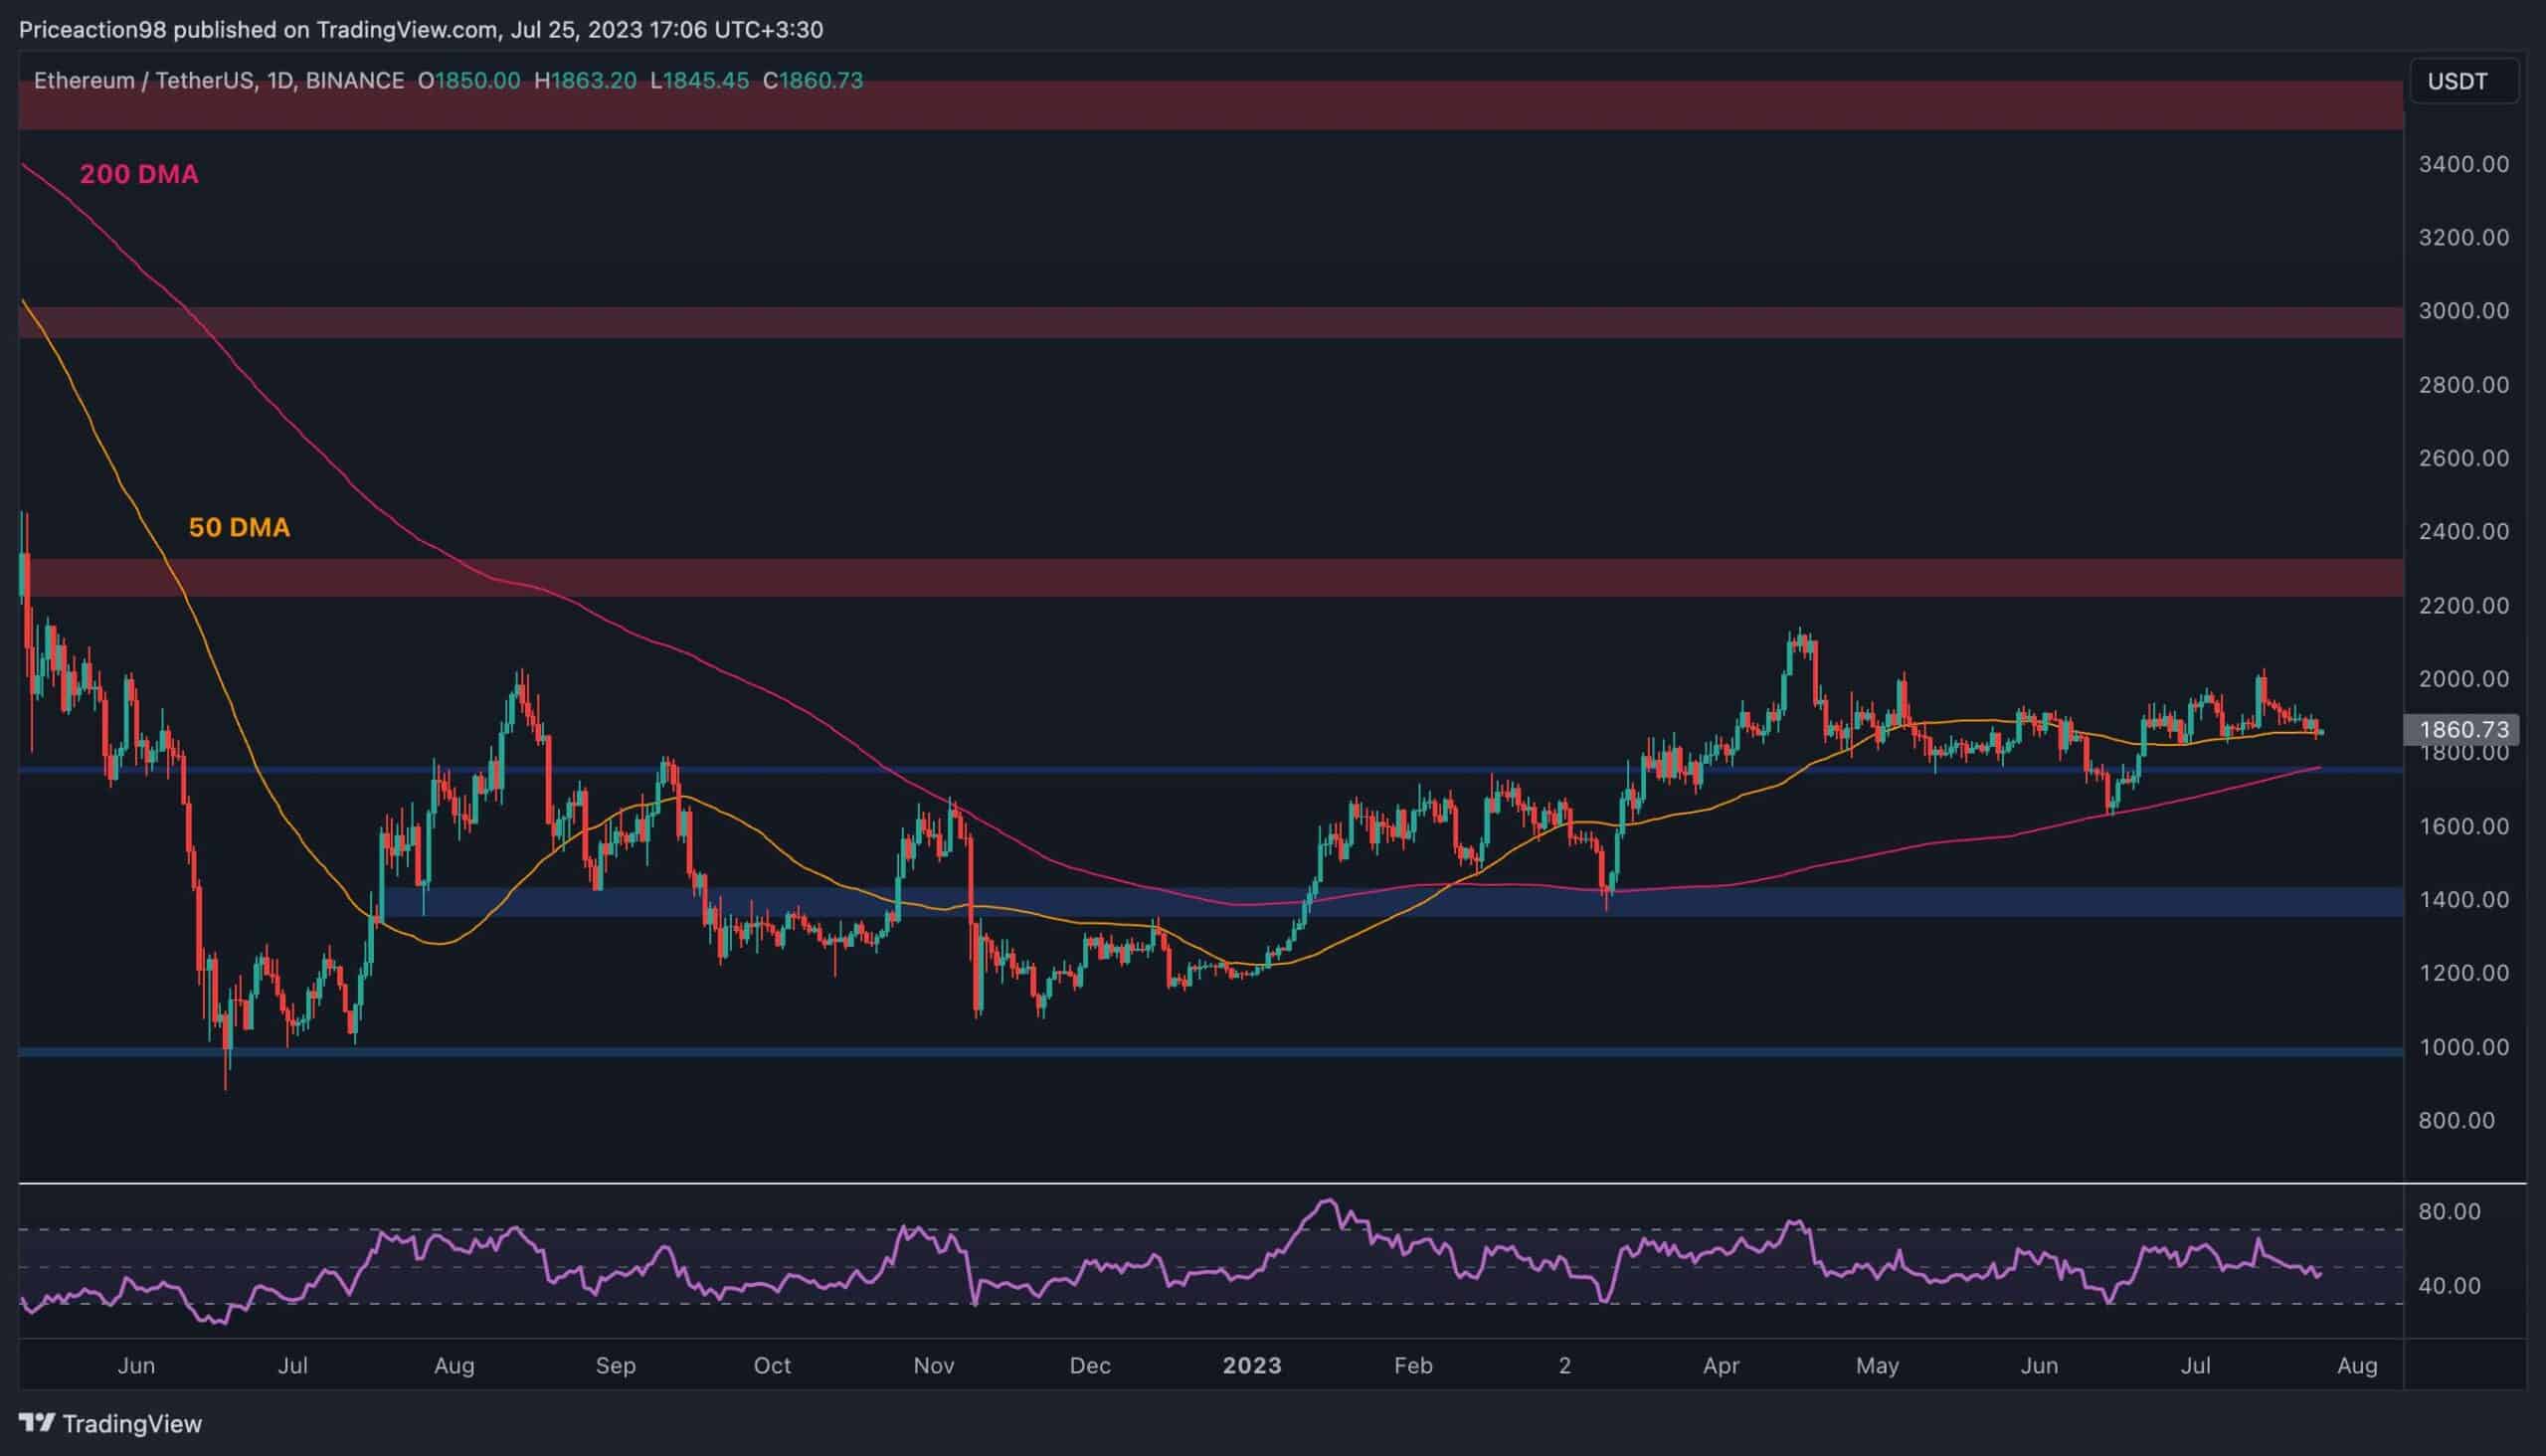
The Daily Chart:
On the daily timeframe, the price has been dropping since getting rejected around the key $2,000 level. The 50-day moving average is providing support near $1,850 at the moment.
However, if it breaks down, the 200-day moving average located around the $1,800 level can be counted as the next strong support zone. On the other hand, if the price rebounds from either of these levels, a rally toward $2,300 would be highly probable in the coming weeks.
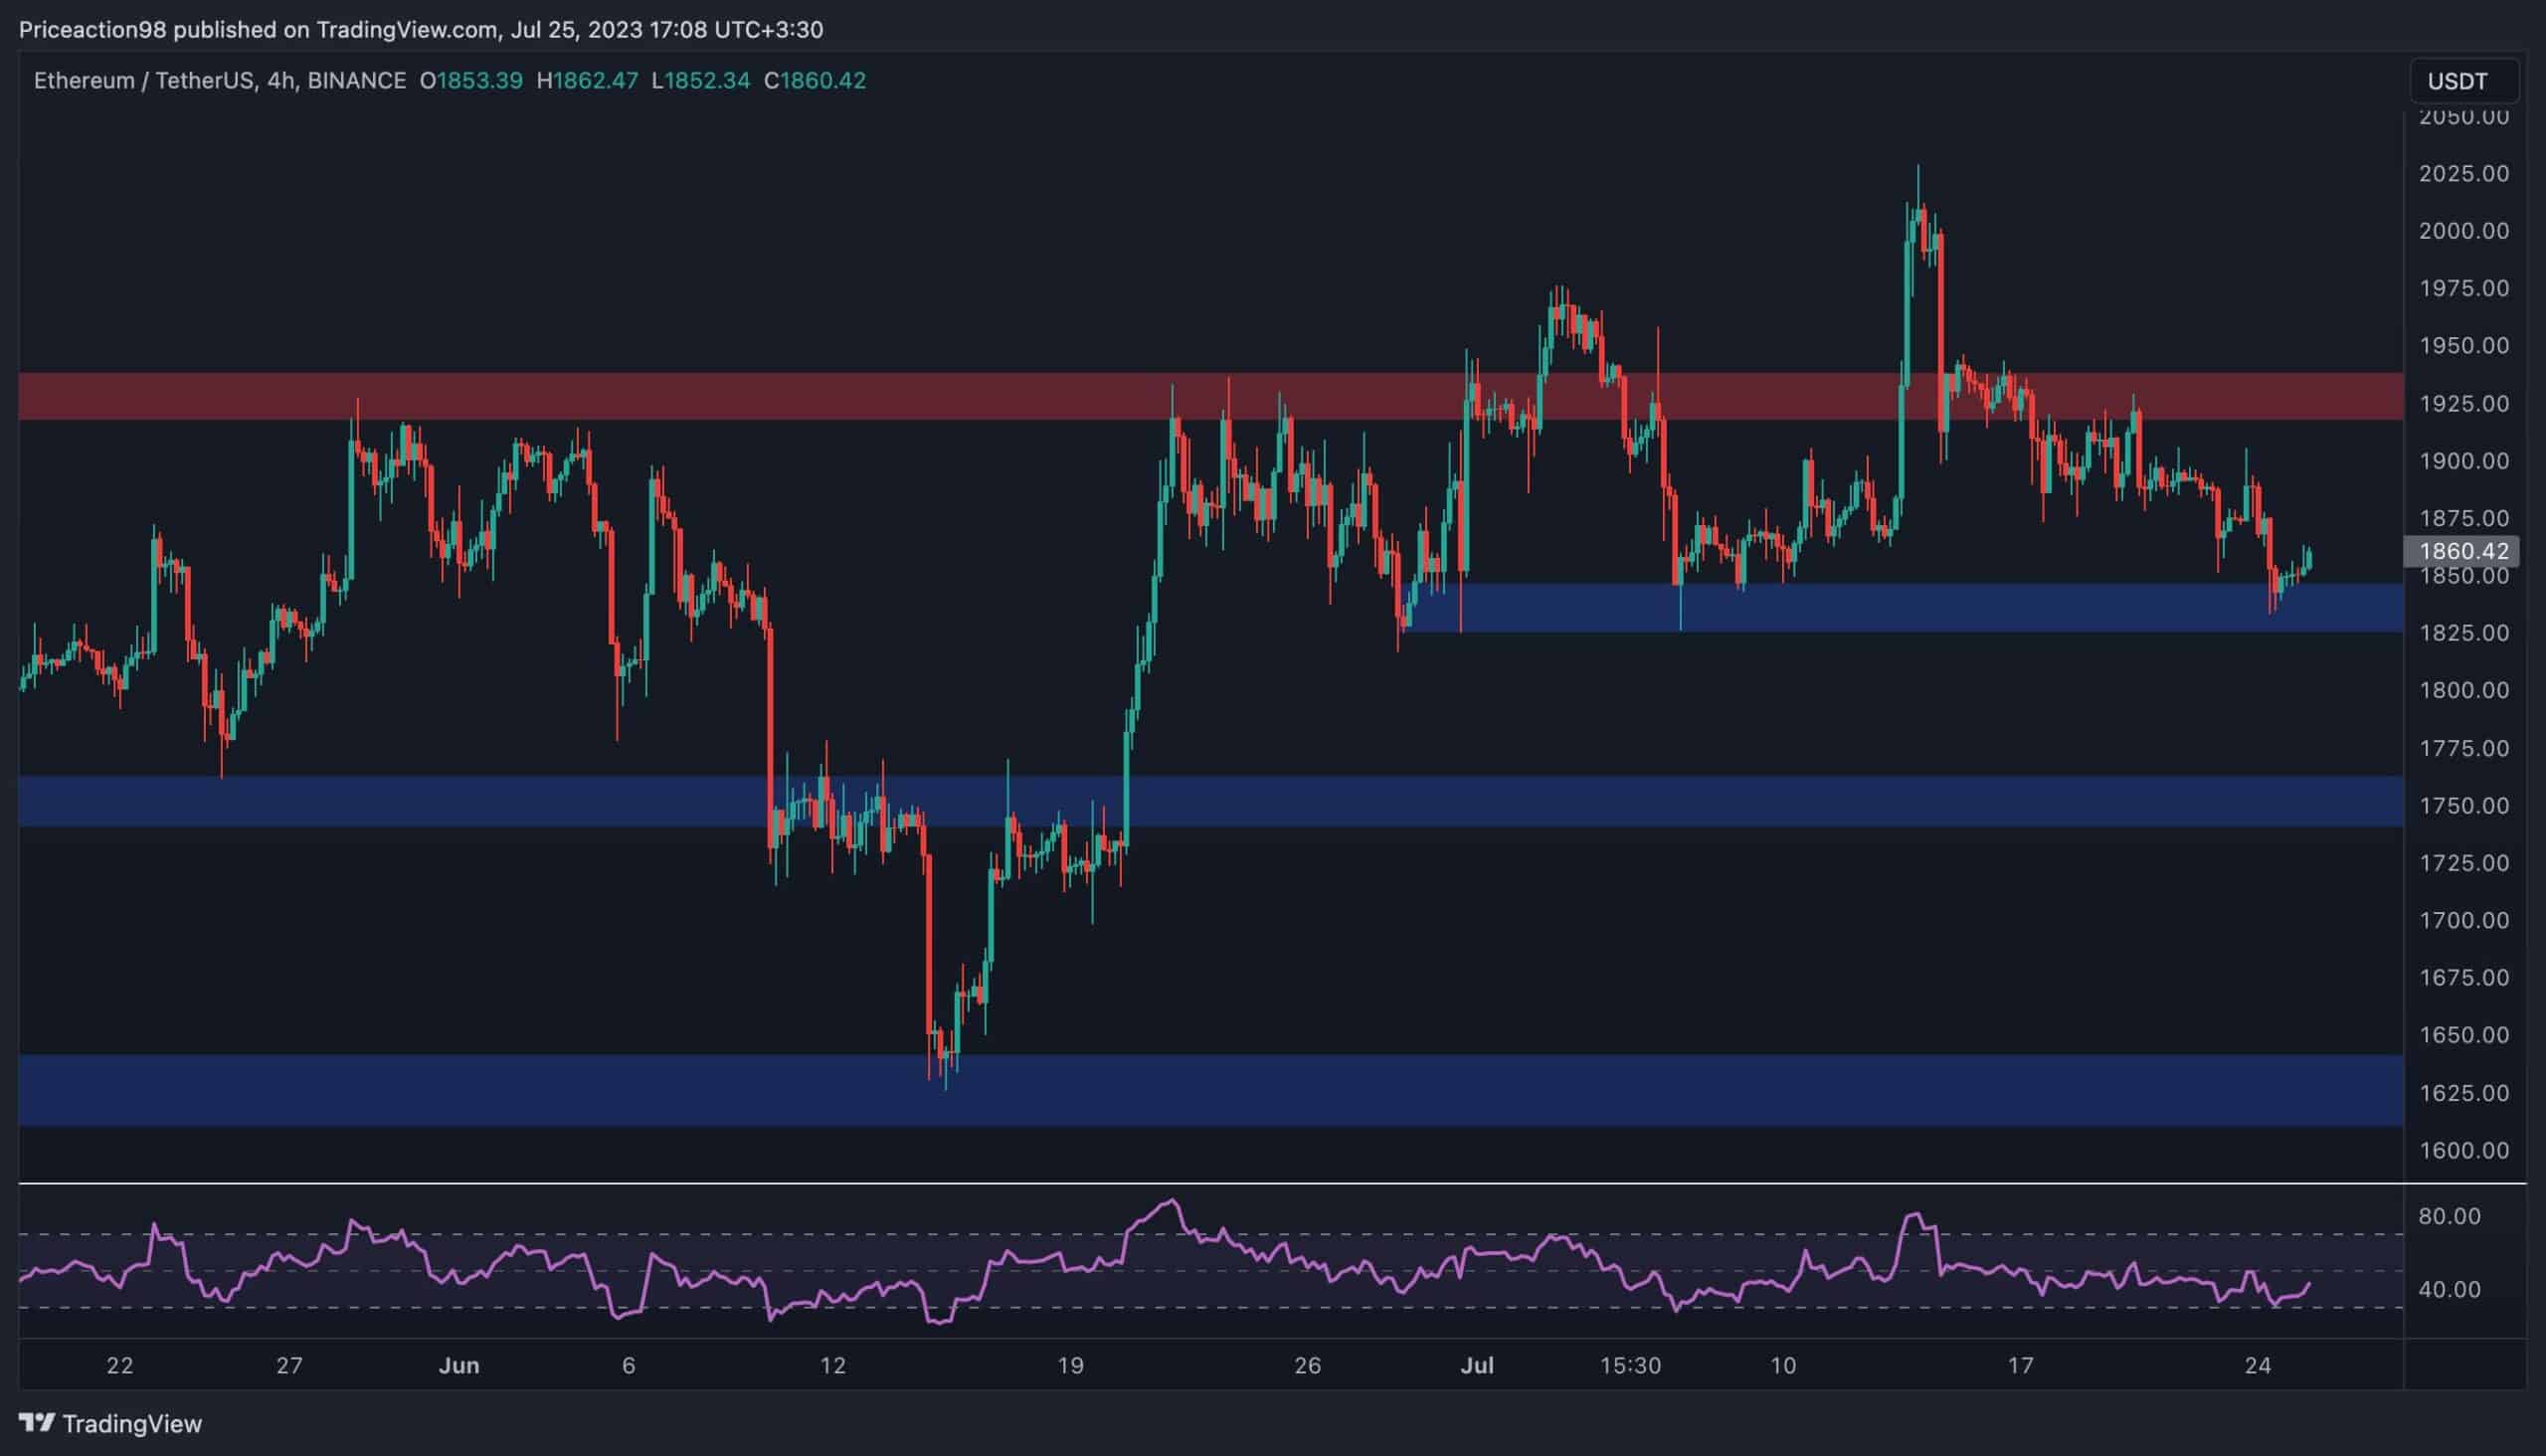
The 4-Hour Chart:
Looking at the 4-hour chart, the price is getting supported at the $1,850 level, following a bearish reversal from the $1,930 resistance zone. While the market is rebounding, there is still a high probability of the breakdown of the $1,850 level in the short term.
In this scenario, a further decline toward $1,750 could be expected. The RSI indicator also demonstrates values below 50%, pointing to the current bearish momentum. Therefore, another bearish move is likely on the horizon before a rally toward the $2,000 mark or higher may be expected.
Sentiment Analysis
By: Edris
Ethereum’s price is currently consolidating around the $2,000 level without showing any intention to rally higher.
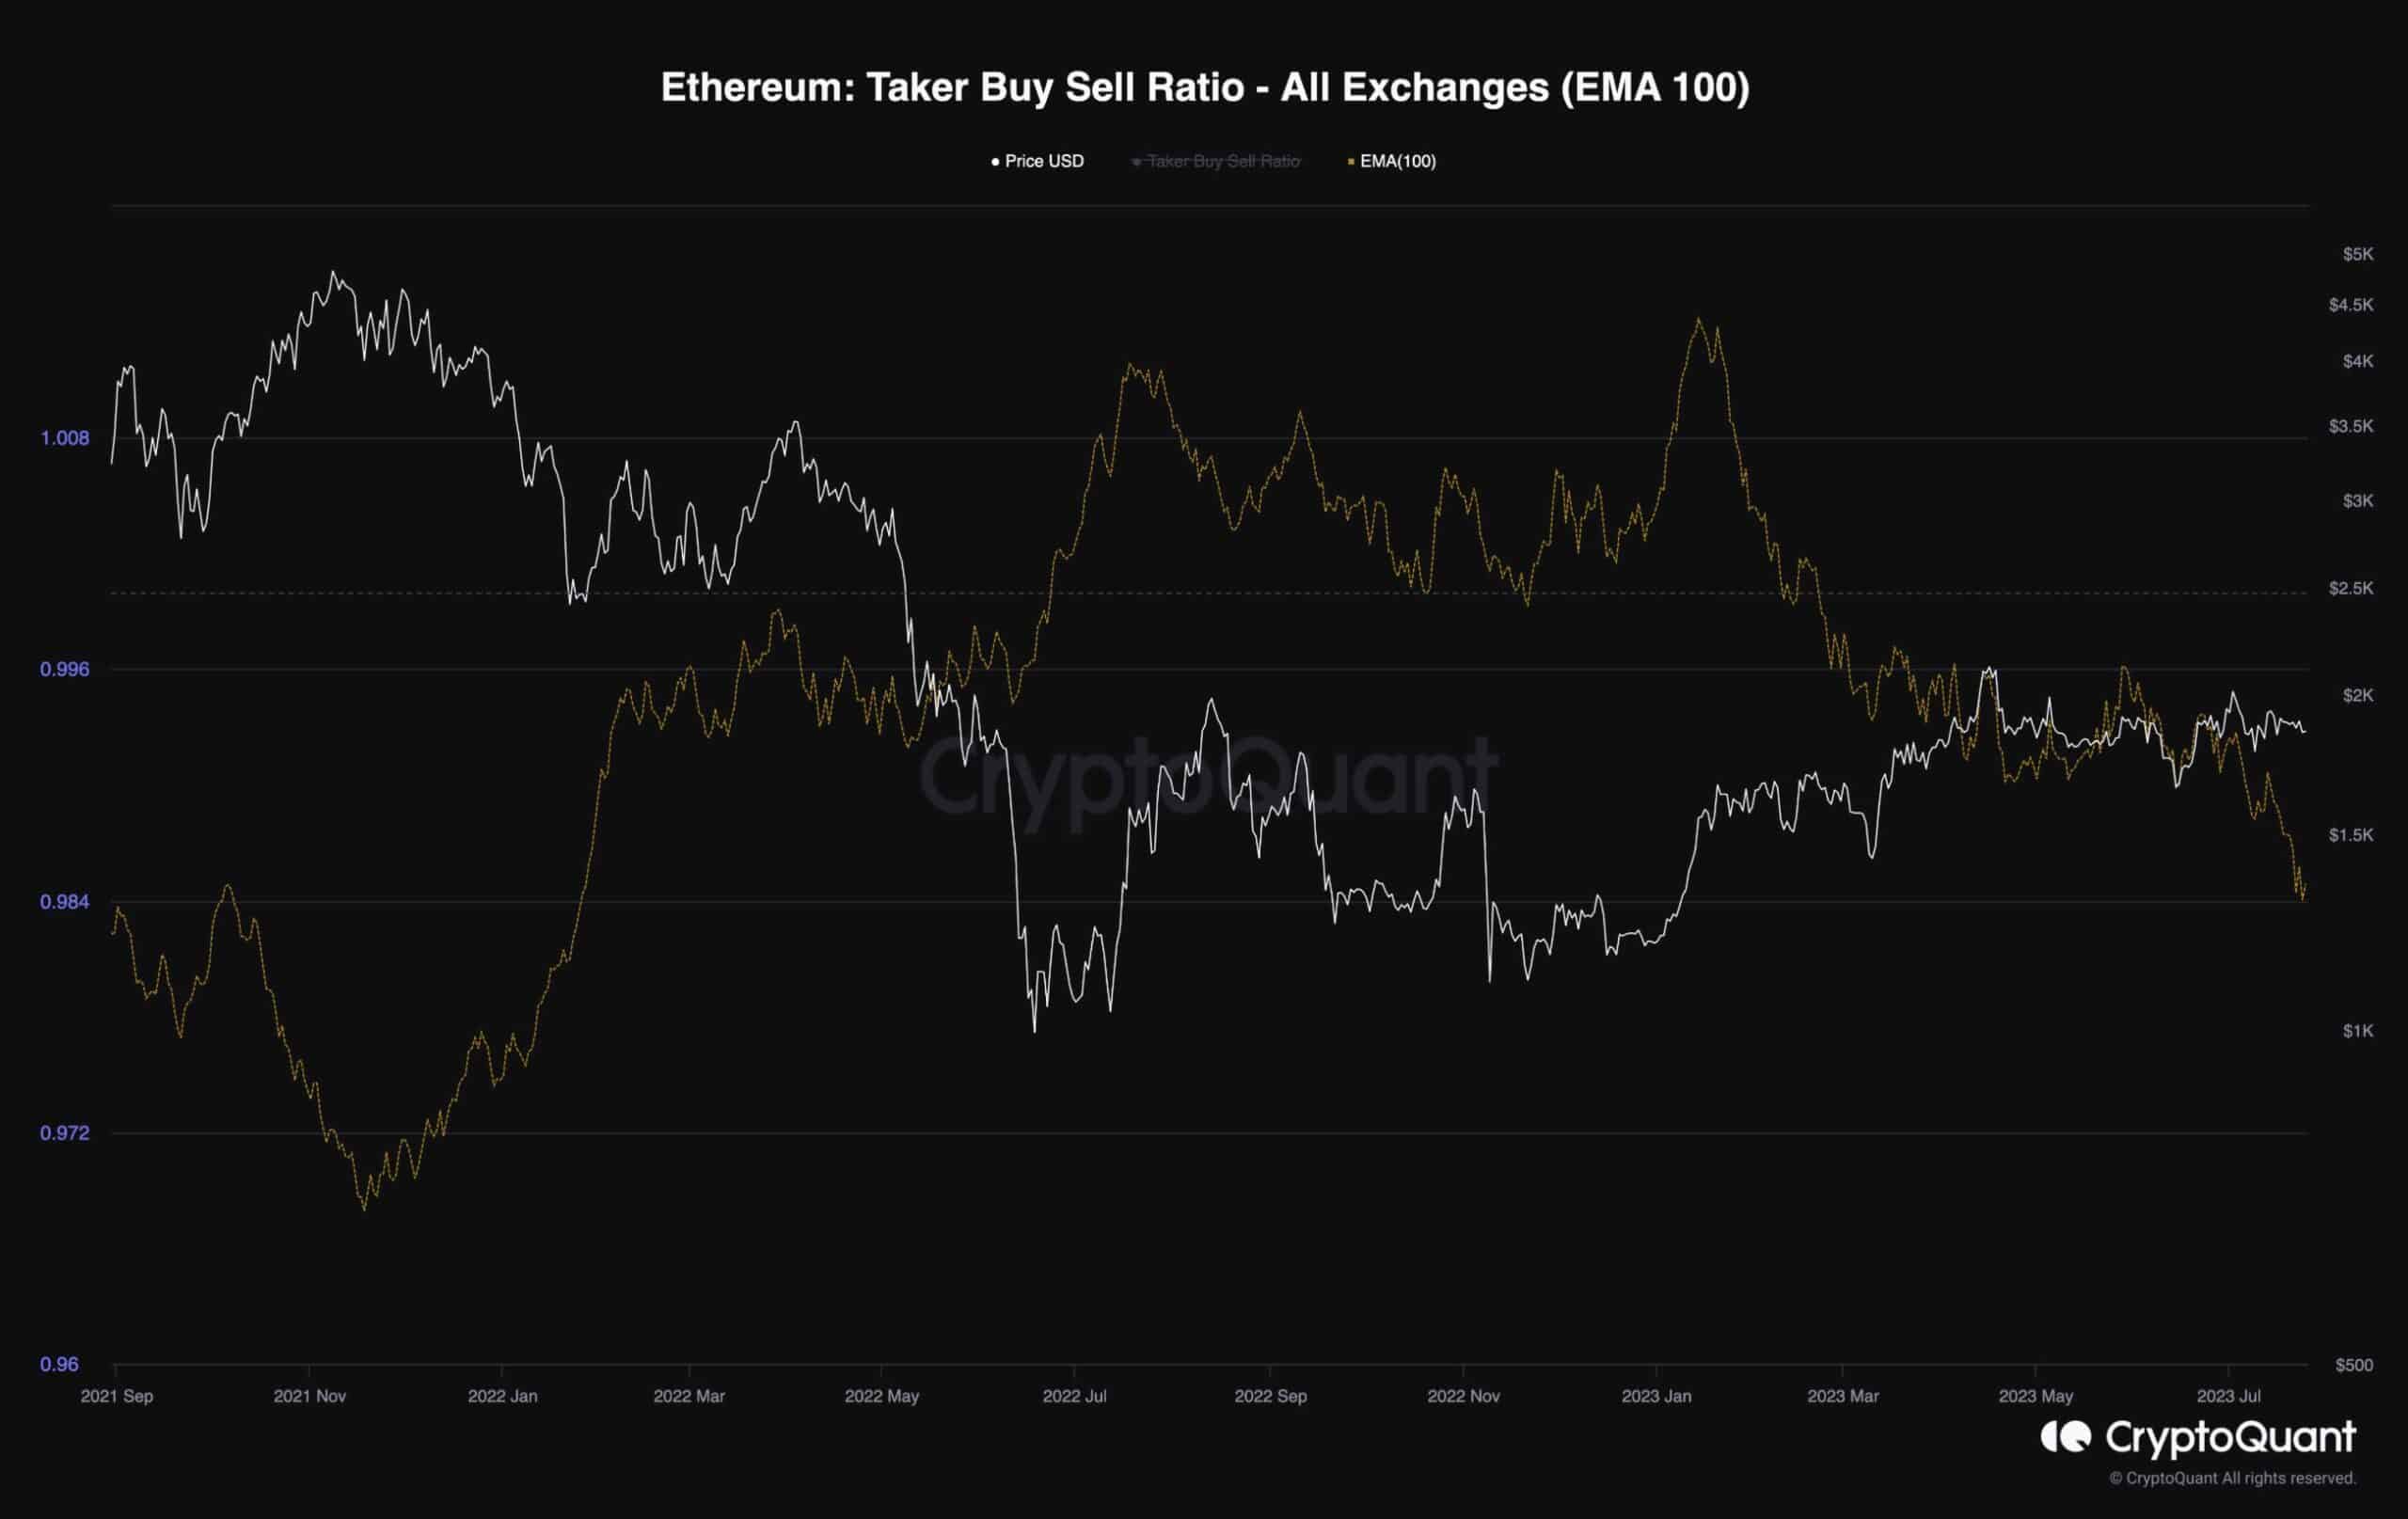
One of the most valuable metrics in evaluating the futures market sentiment is the taker buy-sell ratio, which shows whether the buyers or the sellers are executing their trades more aggressively. Values above 1 indicate bullish sentiment, while values below one are associated with a bearish sentiment.
The metric has dropped below 1, indicating that the sellers are selling aggressively. This pressure is one of the prominent reasons for the price’s failure to climb higher. Moreover, this behavior can also lead to a bearish downturn in price if nothing changes soon.
The post More Troubles Ahead for ETH Following the Failure at $2K? (Ethereum Price Analysis) appeared first on CryptoPotato.