Mining Fee Market Shows Signs Of Life Despite Bitcoin Price Downturn
Even as the bitcoin price struggles, transaction fee data demonstrates that bitcoin miners will weather the storm.
Bitcoin fee markets are showing small signs of life despite bitcoin’s price dropping roughly 70% since its latest all-time highs and hash price — a measure of the value for hash rate — falling by roughly the same amount.
Fees and the long-term prospects of fee revenue for miners is a hotly-debated topic, especially during bearish market trends. Bear markets are prime time for arguing about fees not only because market participants are bored and antsy, but also because this source of revenue dwindles considerably during these periods.
Despite the on-going bear market — which just finished its eighth consecutive month — the bitcoin fee market is still showing signs of life. This article provides an overview of a few bits of surprising bear market fee data, and it discusses in context of these numbers the likelihood of deciding whether or not Bitcoin’s future is doomed or relatively positive, despite what a growing number of loud critics continue to assert.
Bitcoin Bear Market Fee Data
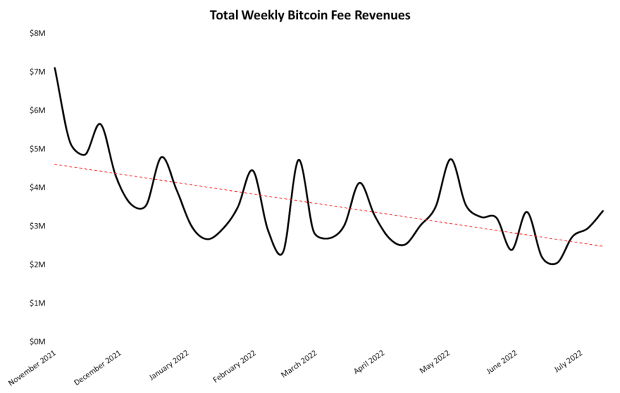
Starting with absolute fee revenue, the trend in dollar-denominated fee growth is still slightly downward. Most of the drop occurred through the final months of 2021, however, and year-to-date fees have been mostly flat. The chart below shows total weekly fee revenue from the market’s peak in November 2021 to date with a logarithmic trend line to highlight the overall fee growth trajectory.

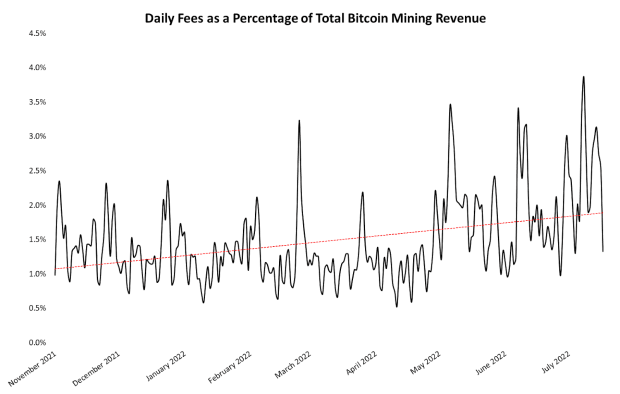
But weekly fees aren’t the most interesting data. Instead, looking at what percentage of mining revenue comes from fees is one of the strongest indicators of the industry’s health. A necessary condition for Bitcoin to have a healthy, long-term outlook is for fee revenue to eventually supplant a significant portion of the current subsidy revenue, such that miners remain incentivized to contribute energy to securing the network despite the eventual disappearance of subsidies, so that hash rate does not drop to dangerously low levels.
Somewhat surprisingly, even though the bitcoin market has continued dropping for months, the percentage of daily mining revenue coming from fees has slowly trended upward since after the start of the market’s price collapse in November 2021.

Of course, fees in the 1% to 3% range are an incredibly large reduction from the 10% to 20% range that miners enjoyed during the heat of the previous bull market. The road to full fee revenue recovery will likely be long, and it will likely depend on the resurgence of bullish price action.
Bitcoin Fee Market Criticisms
Single-digit percentage fee revenues are sure to bear the brunt of criticisms about Bitcoin for as long as the current bear market persists. Journalists are reporting and opining on perceived bitcoin fee market weaknesses. Some traders and researchers are seemingly convinced that low fees spell death for Bitcoin. And some prominent developers are advocating for changing Bitcoin to include a tail emission as a solution for the less-than-robust fee market.
Even after the market trend shifts, some of the critics will continue hammering their talking points as other blockchains see increased use of various applications not (yet?) built on Bitcoin. And some Bitcoin-adjacent builders are optimistic that a more robust fee market will come as more applications are built on Bitcoin.
But setting aside all of this conjecture, criticism and (in some cases) general craziness, it’s important to remember that fee data shows that — if nothing else — fee revenue is cyclical, just like price trends. And mentioned previously, bear markets (when fee revenue is low) are prime opportunities in this cycle to highlight perceived fundamental weaknesses in network fees.
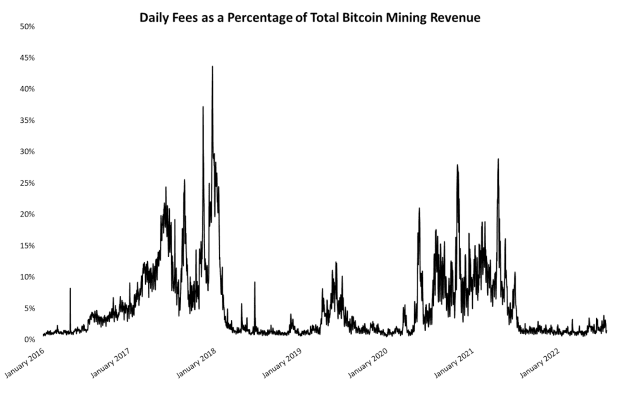
The line chart below shows daily fees as a percent of total mining revenue since early 2016. From even a cursory glance at the visualization, it’s easy to notice how the two major spikes in fee revenue coincide directly with the latest two bitcoin bull market periods. Also, the quasi-bullish market period during 2019 and a concurrent spike in fee revenue is apparent.

There are no indications that this cyclical fee pattern will break from bitcoin’s cyclical price action. The most likely short-term outcome is a continued battering of fee data by critics for as long as the bearish trend lasts.
But most builders and investors in the Bitcoin economy realize that current fee data is something that should be monitored but not panicked over. And cyclically-volatile fee revenue during the early years of Bitcoin’s second decade is not a catastrophic problem.
The Future Of Bitcoin Fees
Bitcoin’s fee market and “security budget” (the sum of fee revenue and block subsidies) will always be meticulously-analyzed and hotly-debated topics. These conversations will likely become even more contentious as alternative blockchain protocols garner significant fee revenue — at times even more so than Bitcoin’s numbers — from various applications built for different use cases in the broader cryptocurrency industry.
But the Bitcoin economy continues to go strong, and despite what the loudest critics say, the current data gives no reason for long-term concern. Use of Bitcoin scaling protocols (e.g., the Lightning Network) continues growing, the mining sector continues building and expanding despite the bear market, and general use and awareness of Bitcoin is still strong, considering market conditions.
This is a guest post by Zack Voell. Opinions expressed are entirely their own and do not necessarily reflect those of BTC Inc or Bitcoin Magazine.


