Matic Price Analysis: MATIC Plotting a Recovery Despite Slight 4% Daily Loss
- Matic is trying to bounce back, but the buying volume is currently low.
- It is now holding a previous break level as support after losing almost 4% of its value overnight.
- The price is targeting $0.027 level in the next few days if Bitcoin continues to consolidate.
MATIC/USD: Buyers Showing Interest After 3.12% Discount
Key Resistance Levels: $0.023, $0.025, $0.027
Key Support Levels: $0.021, $0.020, $0.019
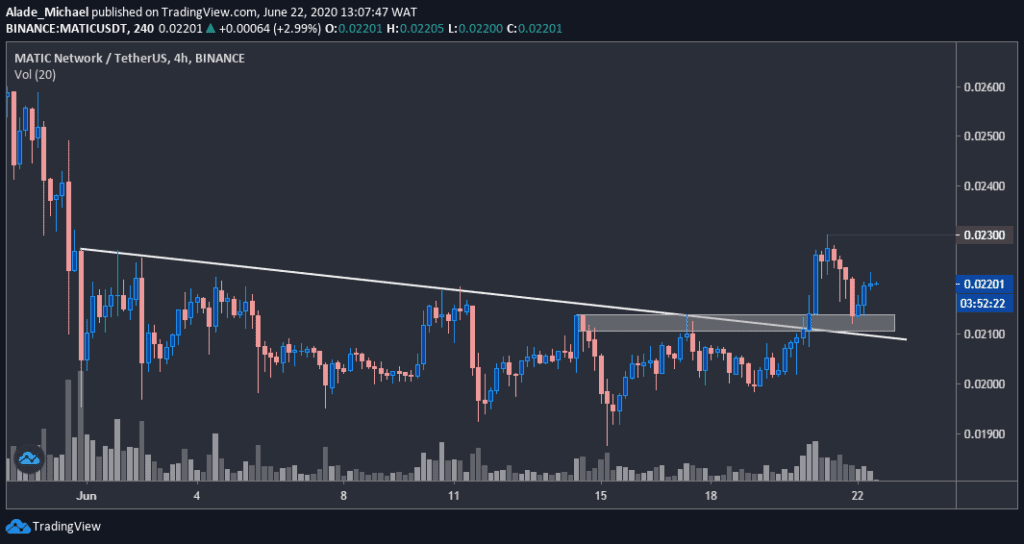
Matic is currently down by 3.12% overnight, but it is starting to show a bullish sign following the June 20 breakout above a three-week resistance line to reach $0.023. After pulling back to near $0.021, the price bounced back to where it’s trading around $0.0219 at the time of writing.
On the current 4-hours chart, it appeared that buyers are stepping back into the market – although the volume is still low at the moment. Matic needs to reclaim $0.023 (last week high) to confirm a bullish continuation.
However, the price is still not far from the bearish zone. A drop below the current holding level of $0.021 could initiate sell actions again. From a technical perspective, the setups look bullish in the short-term.
MATIC Price Analysis
Following the latest bounce, Matic is slowly rising back towards the $0.023 resistance level. Resistance to watch above this lies at $0.025 and perhaps $0.027 in the next few days. As can be seen on the price chart, the volume is slowly increasing by the day.
Below the $0.021 level, marked grey, there’s a key support level at $0.020. The last defense line for the bulls is located at $0.019, where Matic pinned a monthly low on June 15.
MATIC/BTC: Bulls Trying To Regroup But Volume Remains Low
Key Resistance Levels: 245 SAT, 260 SAT, 290 SAT
Key Support Levels: 227 SAT, 214 SAT, 205 SAT
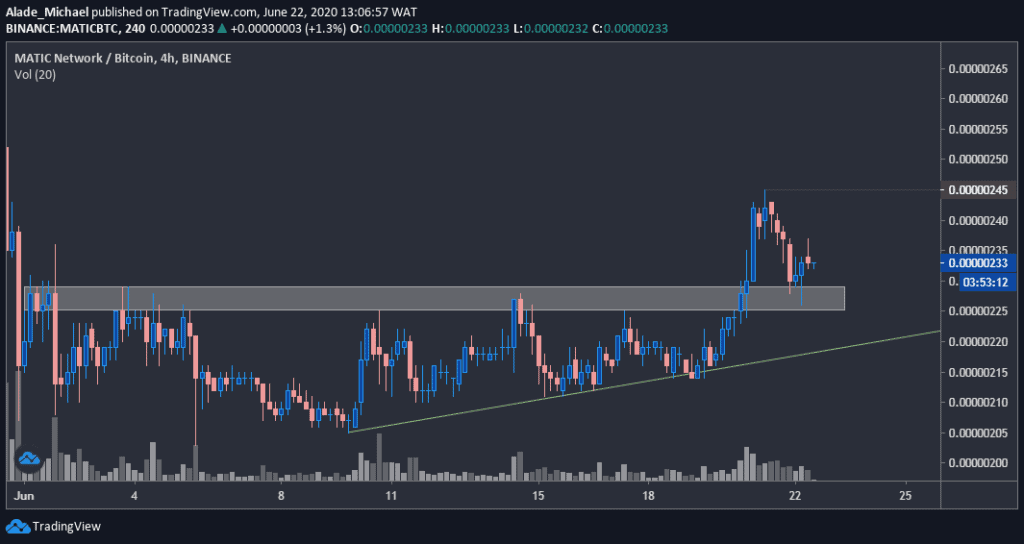
Amidst Bitcoin’s indecisiveness over the past weeks, Matic recently broke a short-term supply area of 227 SAT after maintaining a sideways movement for about three weeks. It now trades around 232 SAT, marking a 3.30% decrease over the past hours.
The previous supply area is now acting as demand, which is where the bulls are trying to regroup again. The last 4-hour candle exhaustion (pin bar) in this area suggests a starting point of a new increase, although the buying volume is not enough at the moment.
MATIC Price Analysis
The first resistance to watch for the incoming price increase is the 245 SAT level (yesterday’s high). A successful push above this should trigger more buy actions to 260 SAT and potentially 290 SAT levels in the coming days.
In the opposite direction, Matic may resume its sideways trend if it loses the 227 SAT demand area. Should such a scenario occur, the next potential support to keep in mind is 214 SAT, followed by the 205 SAT level.
The post Matic Price Analysis: MATIC Plotting a Recovery Despite Slight 4% Daily Loss appeared first on CryptoPotato.


