MATIC Mainnet is Going Live, The Token Surges 22% In 2 Days: Price Analysis & Overview
- Matic saw a 7.5% price surge over the past 24 hours and 22% in the past two days.
- The cryptocurrency rebounded from a rising trend line over the weekend and pushed higher.
- Against Bitcoin, Matic is facing resistance at the 200-days EMA at around 195 SAT.
Key Support & Resistance Levels
MATIC/USD:
Support: $0.016, $0.014, $0.0126.
Resistance: $0.0177, $0.019, $0.02.
MATIC/BTC:
Support: 190 SAT, 180 SAT, 161 SAT.
Resistance: 205 SAT, 218 SAT, 231 SAT.
MATIC/USD – Matic Surges Following Mainnet Launch
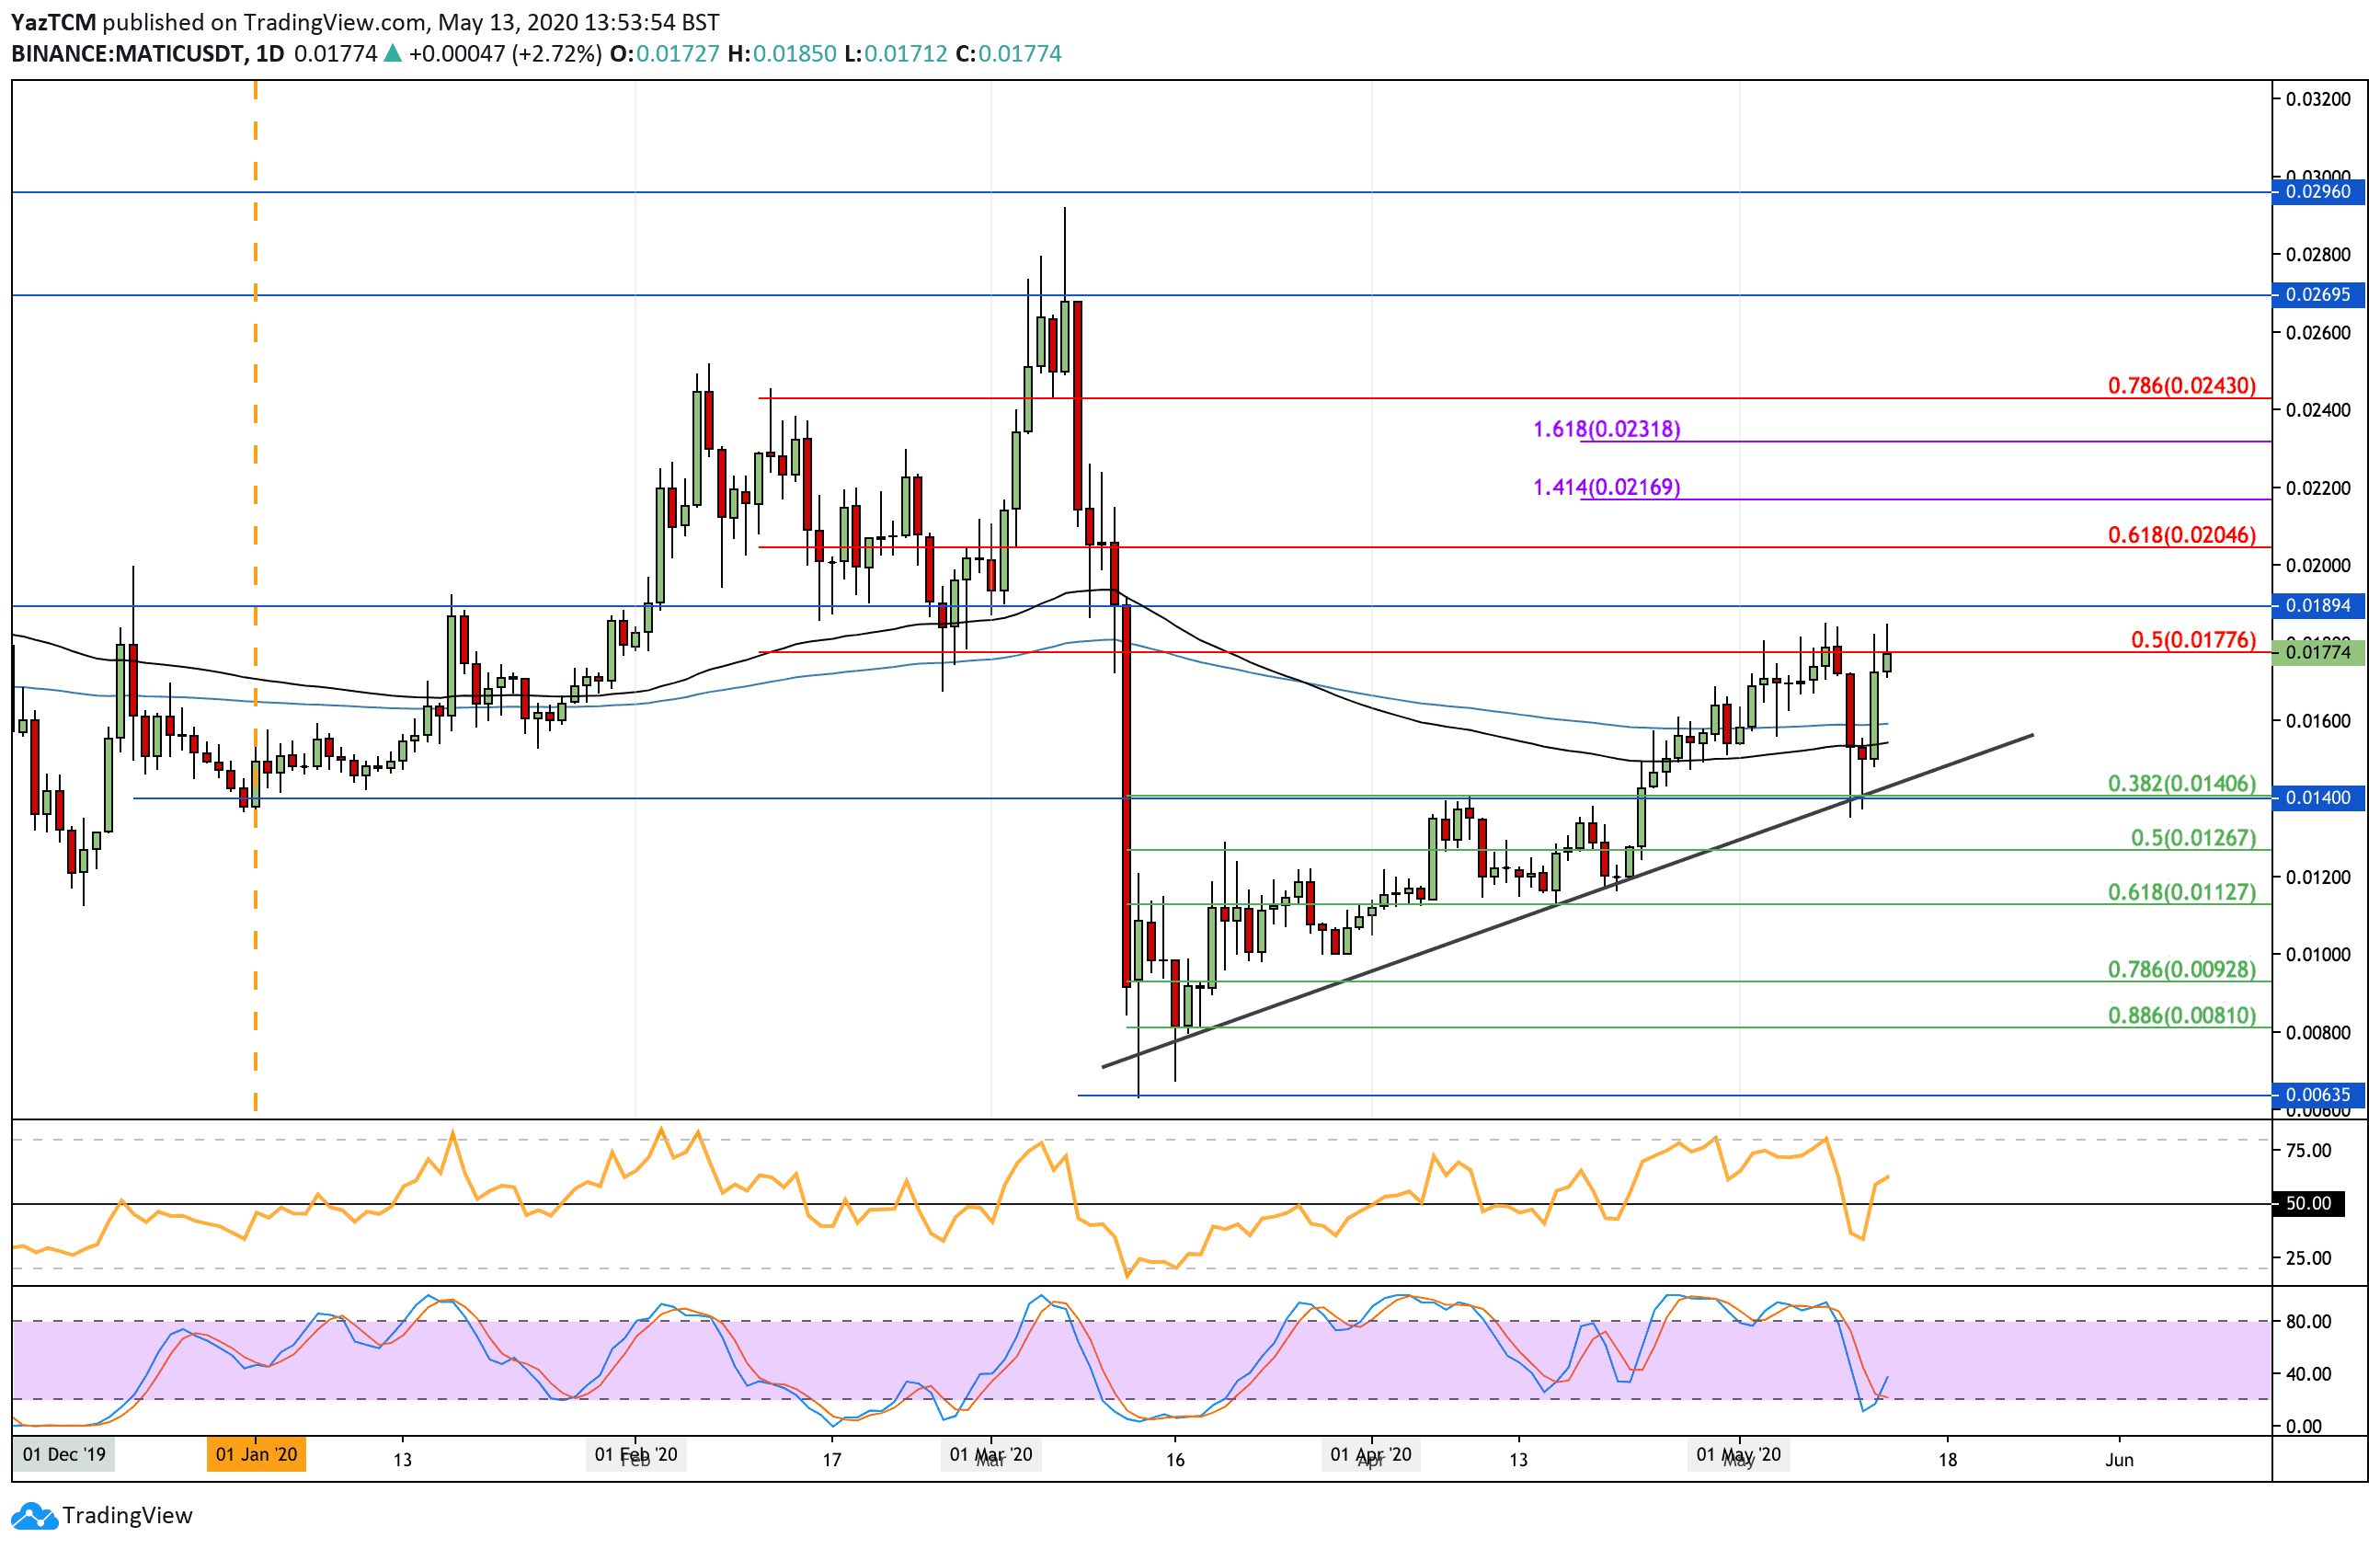
Matic surged by 10% over the past two days of trading as the cryptocurrency managed to break back above the 200-days EMA to reach the $0.0177 level. The coin dropped as low as the $0.008 level during the March market collapse and has been slowly grinding higher as it traded above a rising trend line ever since.
It’s worth noting that the latest surges could largely be attributed to the fact that Matic will officially launch their mainnet on May 15th. Not only that, but Binance US has shown its support for the token as it will be listed on the exchange as soon as the mainnet is live. This might have played a serious part in the price increase.
It still has a long way to recover from the March highs of $0.028 and is now facing resistance at a bearish .5 Fib Retracement level at $0.0177 and must pass this to keep the bull trend in-tact.

MATIC-USD Short Term Price Prediction
Once the bulls pass the $0.0177 level, higher resistance is located at $0.019 and $0.02 (bearish .618 Fib Retracement). Above this, added resistance lies at $0.0216 (1.414 Fib Extension), $0.0231 (1.618 Fib Extension), and $0.0234 (bearish .786 Fib Retracement).
On the other side, if the sellers push lower, the first level of support lies at $0.016 (200-days EMA). Beneath this, support lies at the rising trend line, $0.014 (.382 Fib Retracement), and $0.0126 (.5 Fib Retracement).
The RSI has climbed back above the 50 line to show the bulls have retaken possession of the market momentum. Furthermore, the Stochastic RSI produced a bullish crossover signal as the bullish pressure increases.
MATIC/BTC: Matic On The Verge Of A Range Breakout
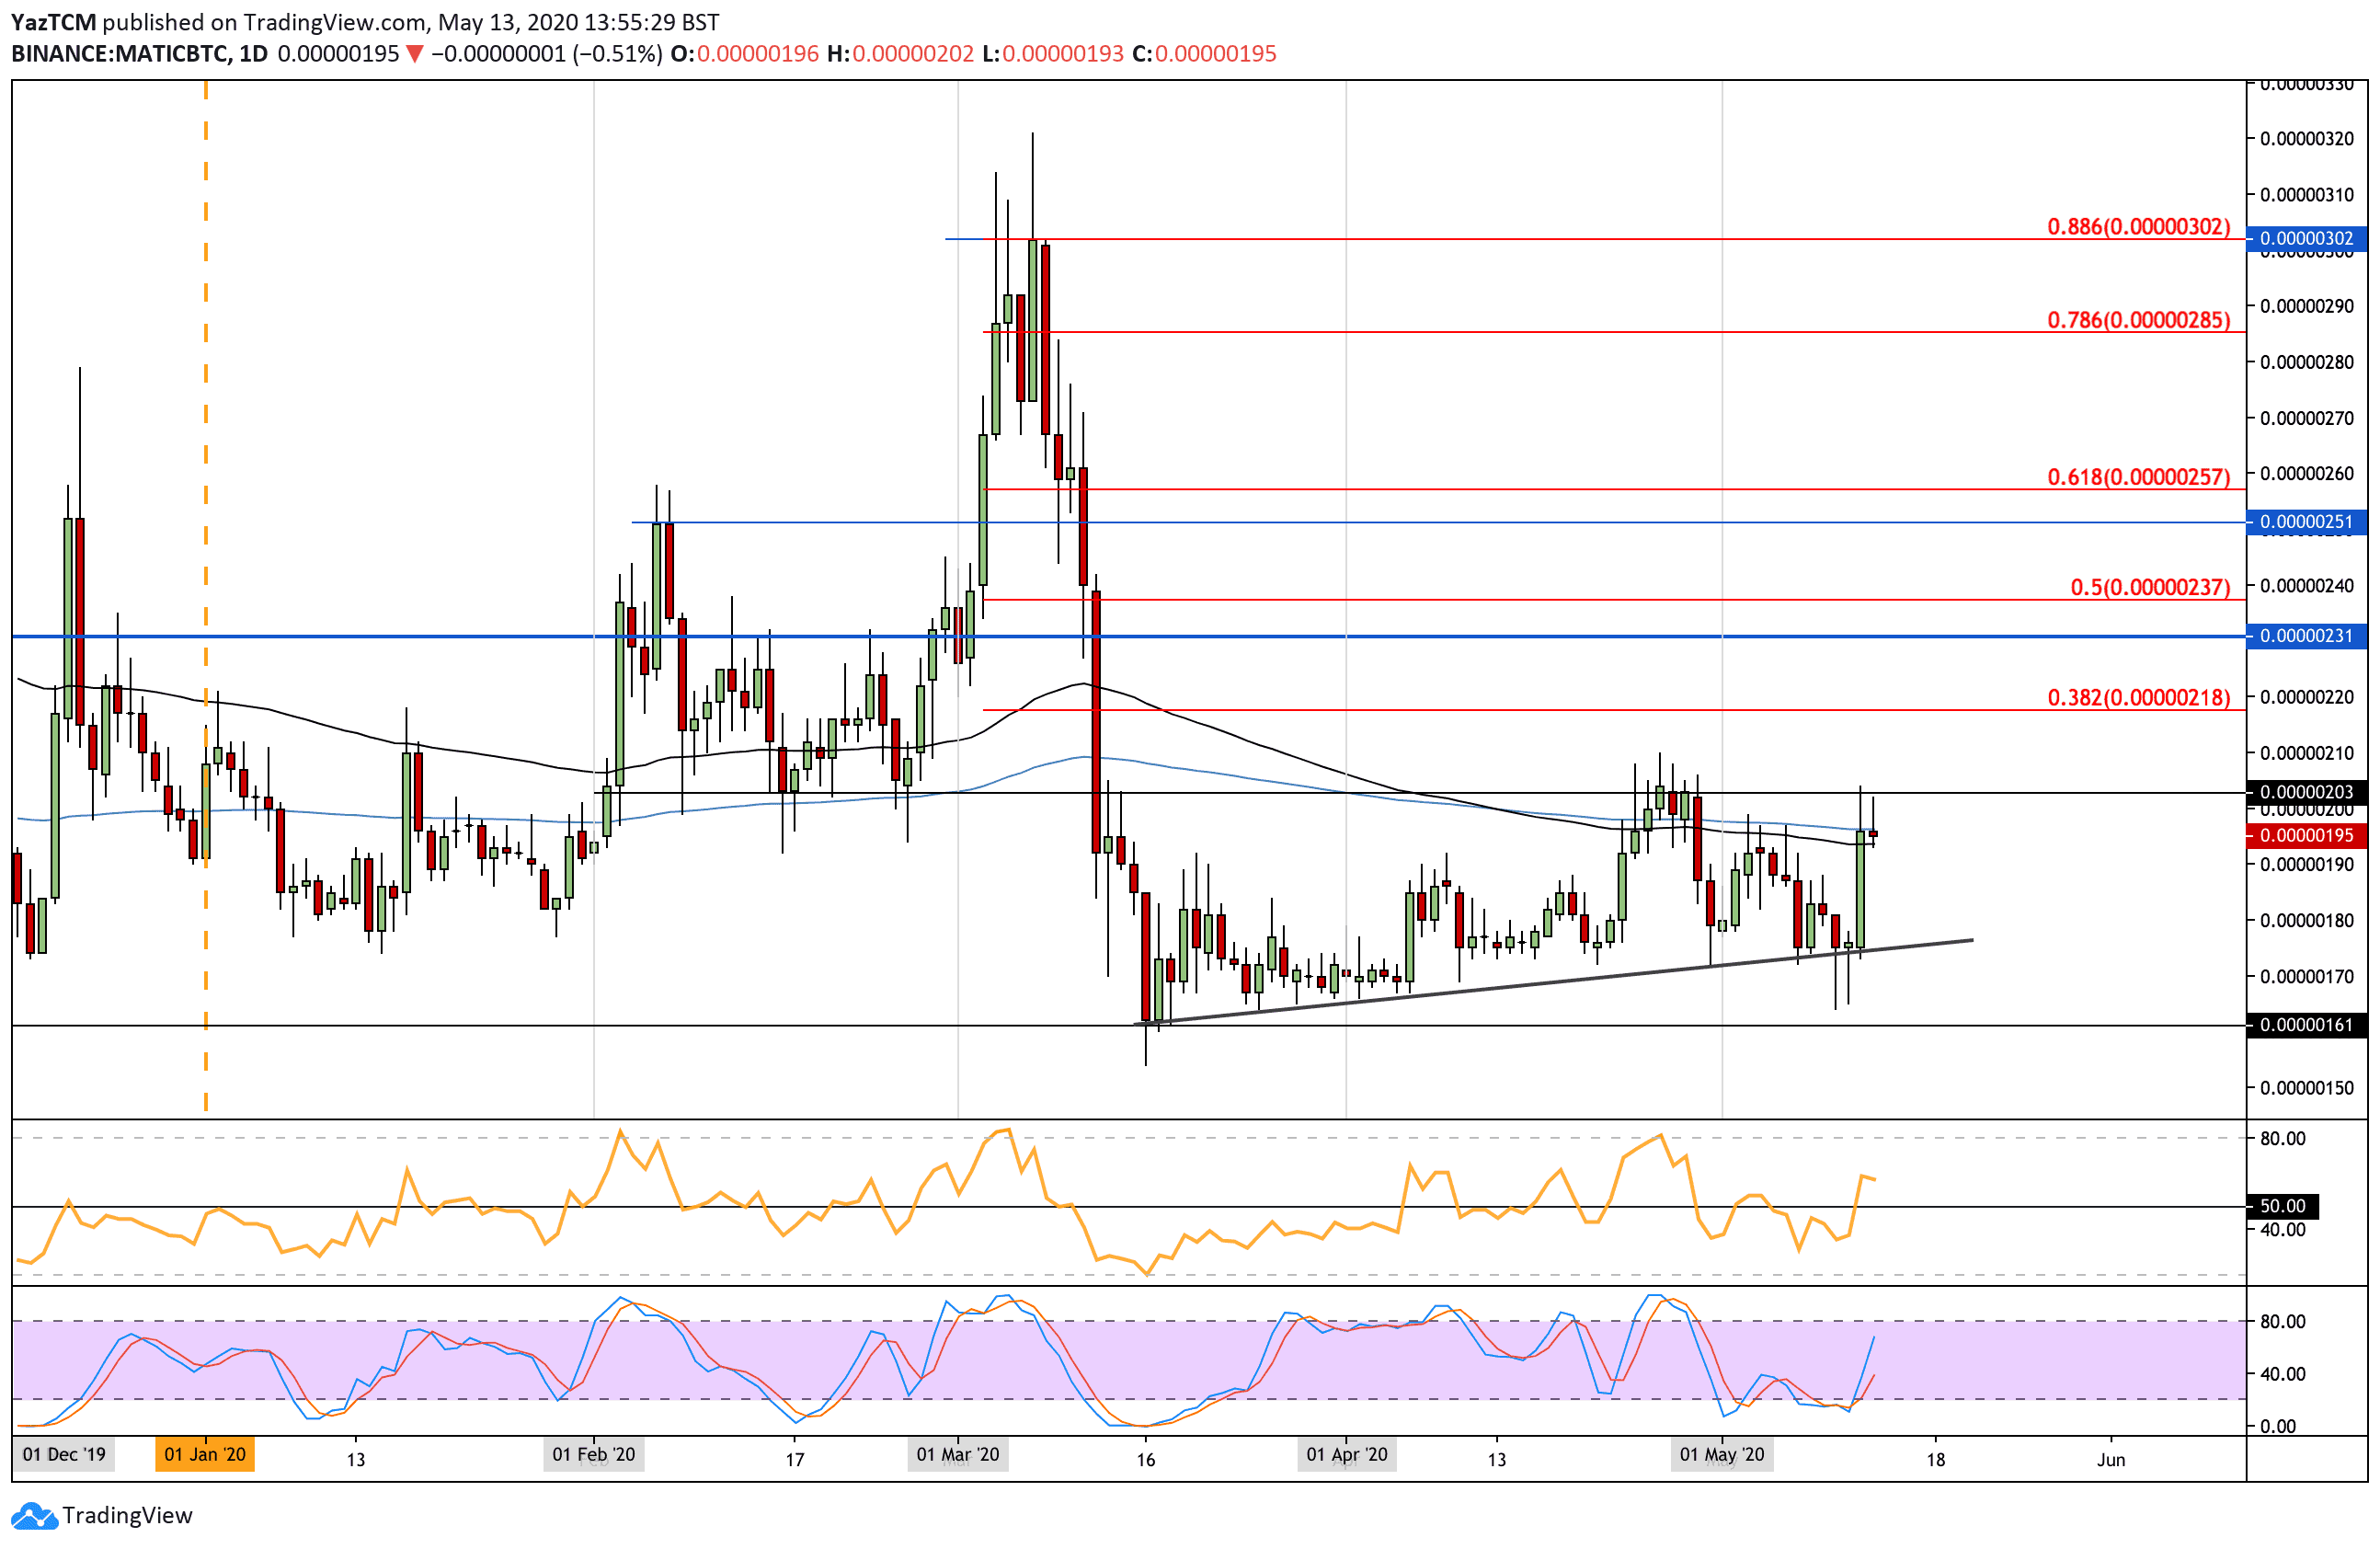
Against Bitcoin, Matic has been quite static since the March market collapse when the coin dropped as low as 161 SAT. It has been slowly pushing higher but has been trapped by resistance at the 205 SAT level in April. The buyers must break this range for the coin to turn bullish.
It is currently trading at the 200-days EMA resistance at 195 SAT and remains above a very shallow rising trend line.

MATIC-BTC Short Term Price Prediction
If the bulls push higher from the 200-days EMA and break the 205 SAT level, higher resistance lies at 218 SAT (bearish .382 Fib Retracement). Above this, resistance lies at 231 SAT, 237 SAT (bearish .5 Fib Retracement), and 250 SAT.
Alternatively, if the sellers push lower, the first level of support lies at 190 SAT. Beneath this, support is located at 180 SAT, the rising trend line, and 161 SAT.
The RSI is also above the 50 line to show the bulls are in charge of the market momentum. If it can continue to rise higher, MATIC can be expected to break the 205 SAT resistance. The Stochastic RSI also produced a bullish crossover signal that will help MATIC climb.
The post MATIC Mainnet is Going Live, The Token Surges 22% In 2 Days: Price Analysis & Overview appeared first on CryptoPotato.


