Massive XRP Move Becomes More Likely: What’s the Next Target? (Ripple Price Analysis)
Ripple’s price has been navigating an extended sideways consolidation phase, displaying slight volatility. As the price approaches the narrow confines of the symmetrical triangle pattern, the potential for a significant move in either direction becomes increasingly likely.
XRP Analysis
By Shayan
Ripple Price Analysis: The Daily Chart
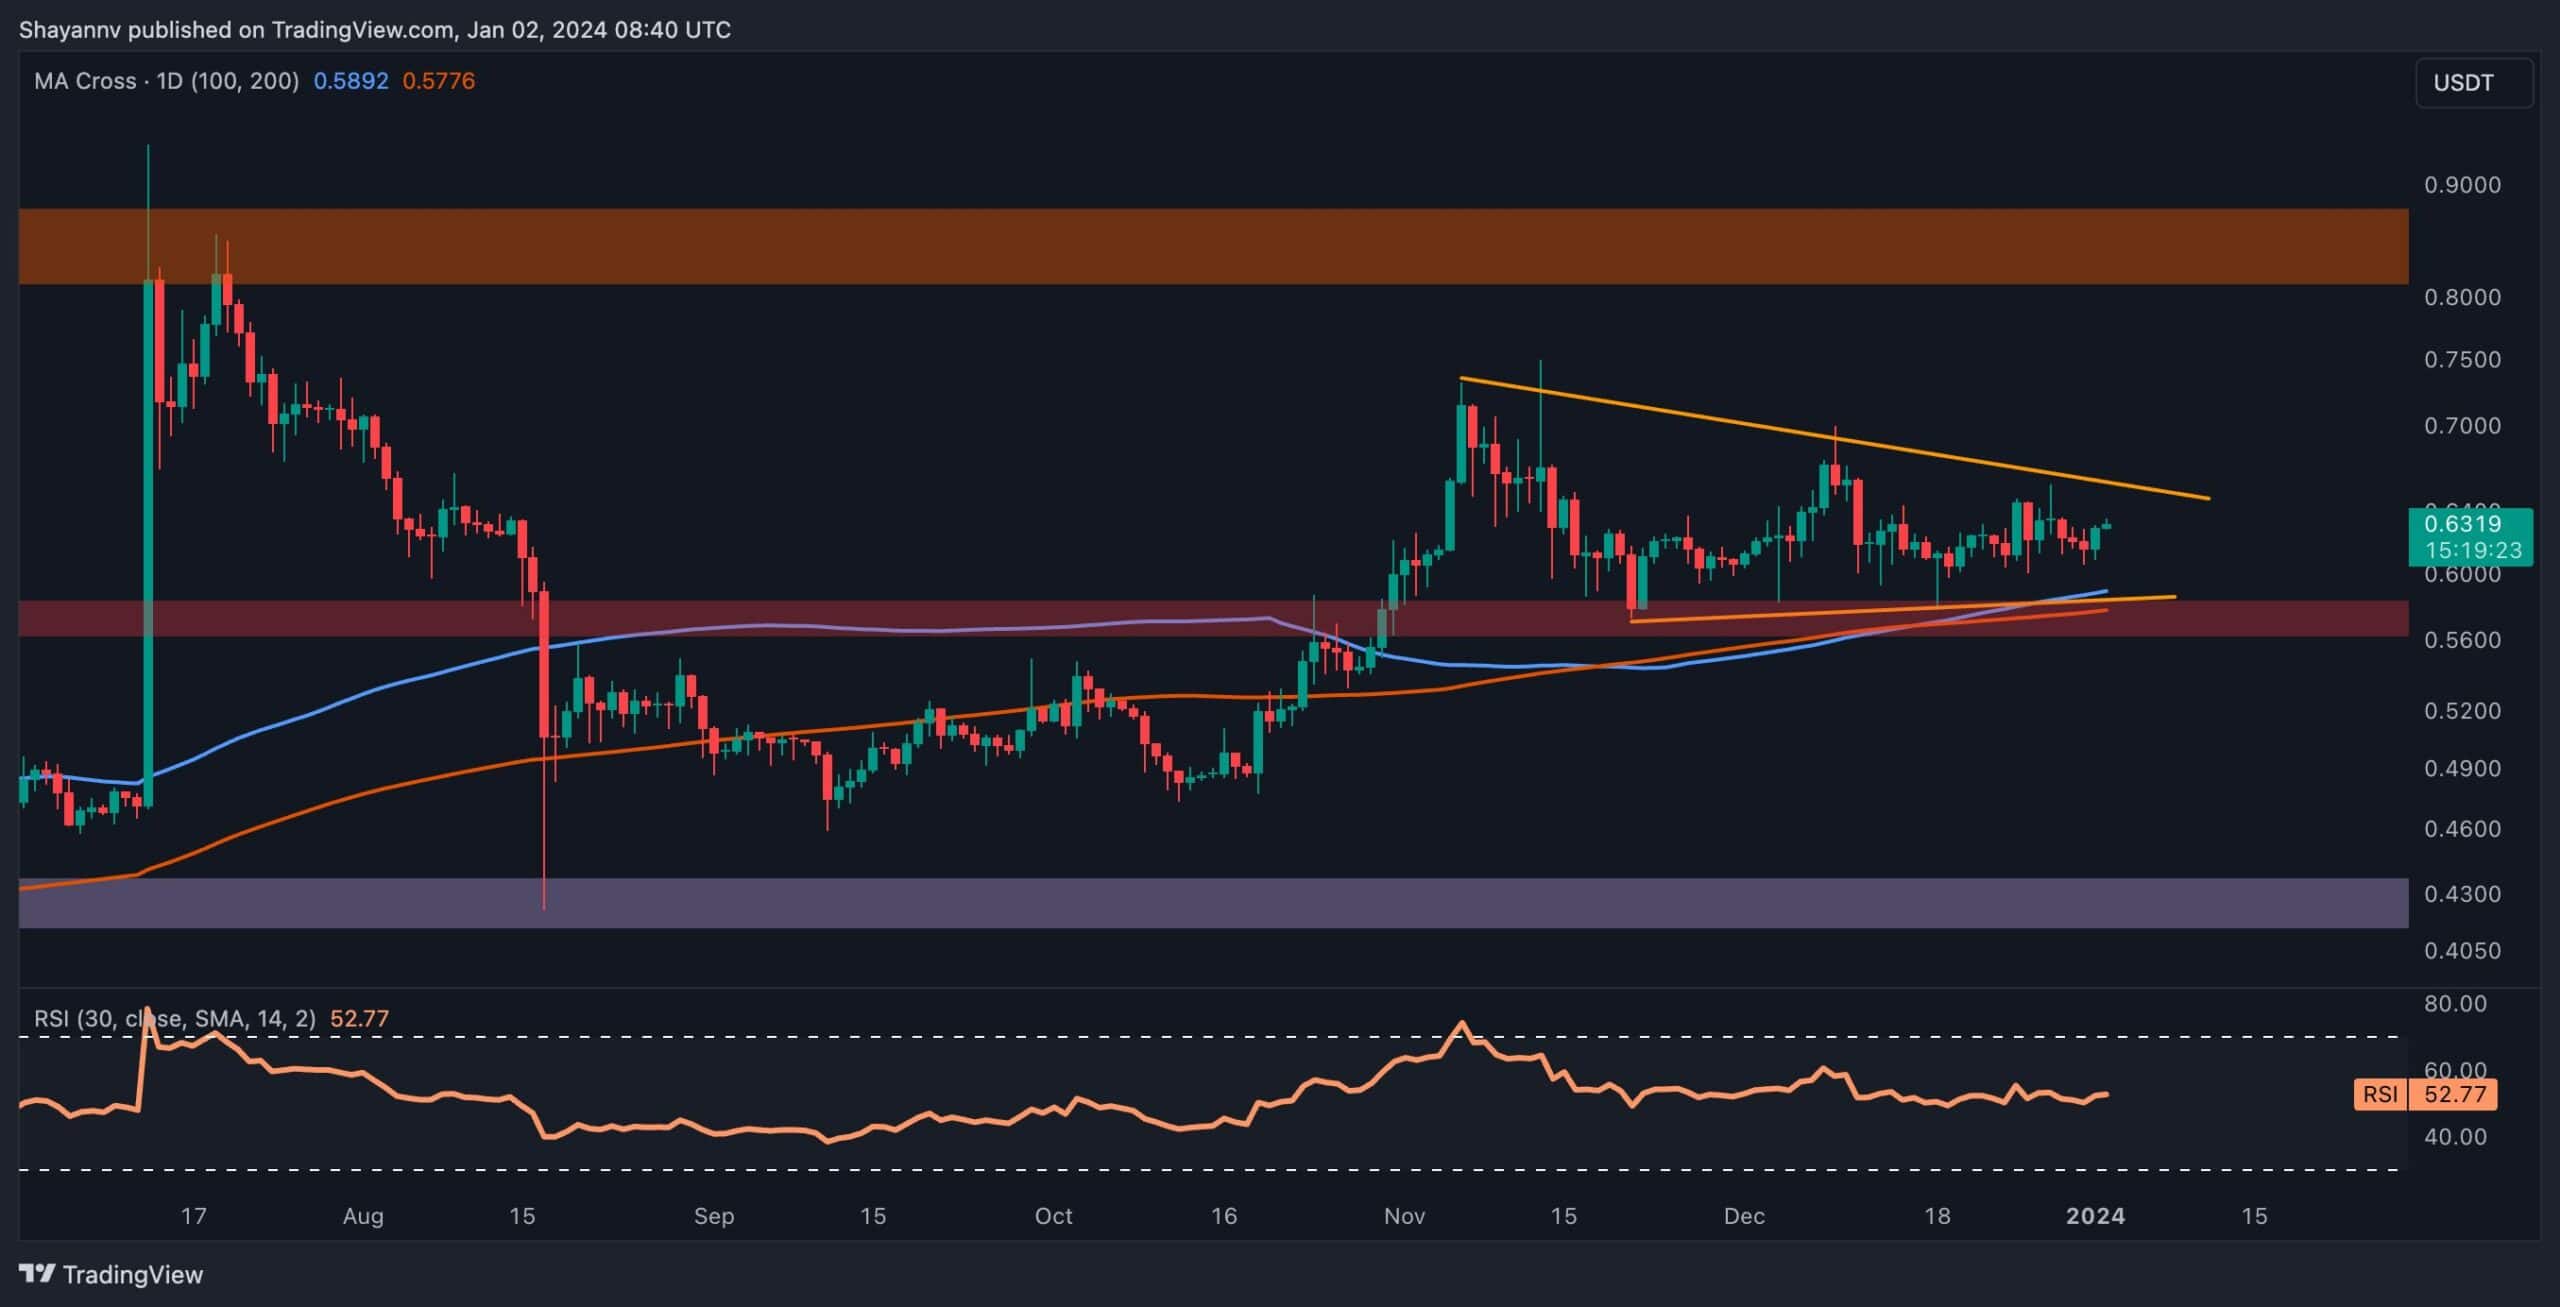
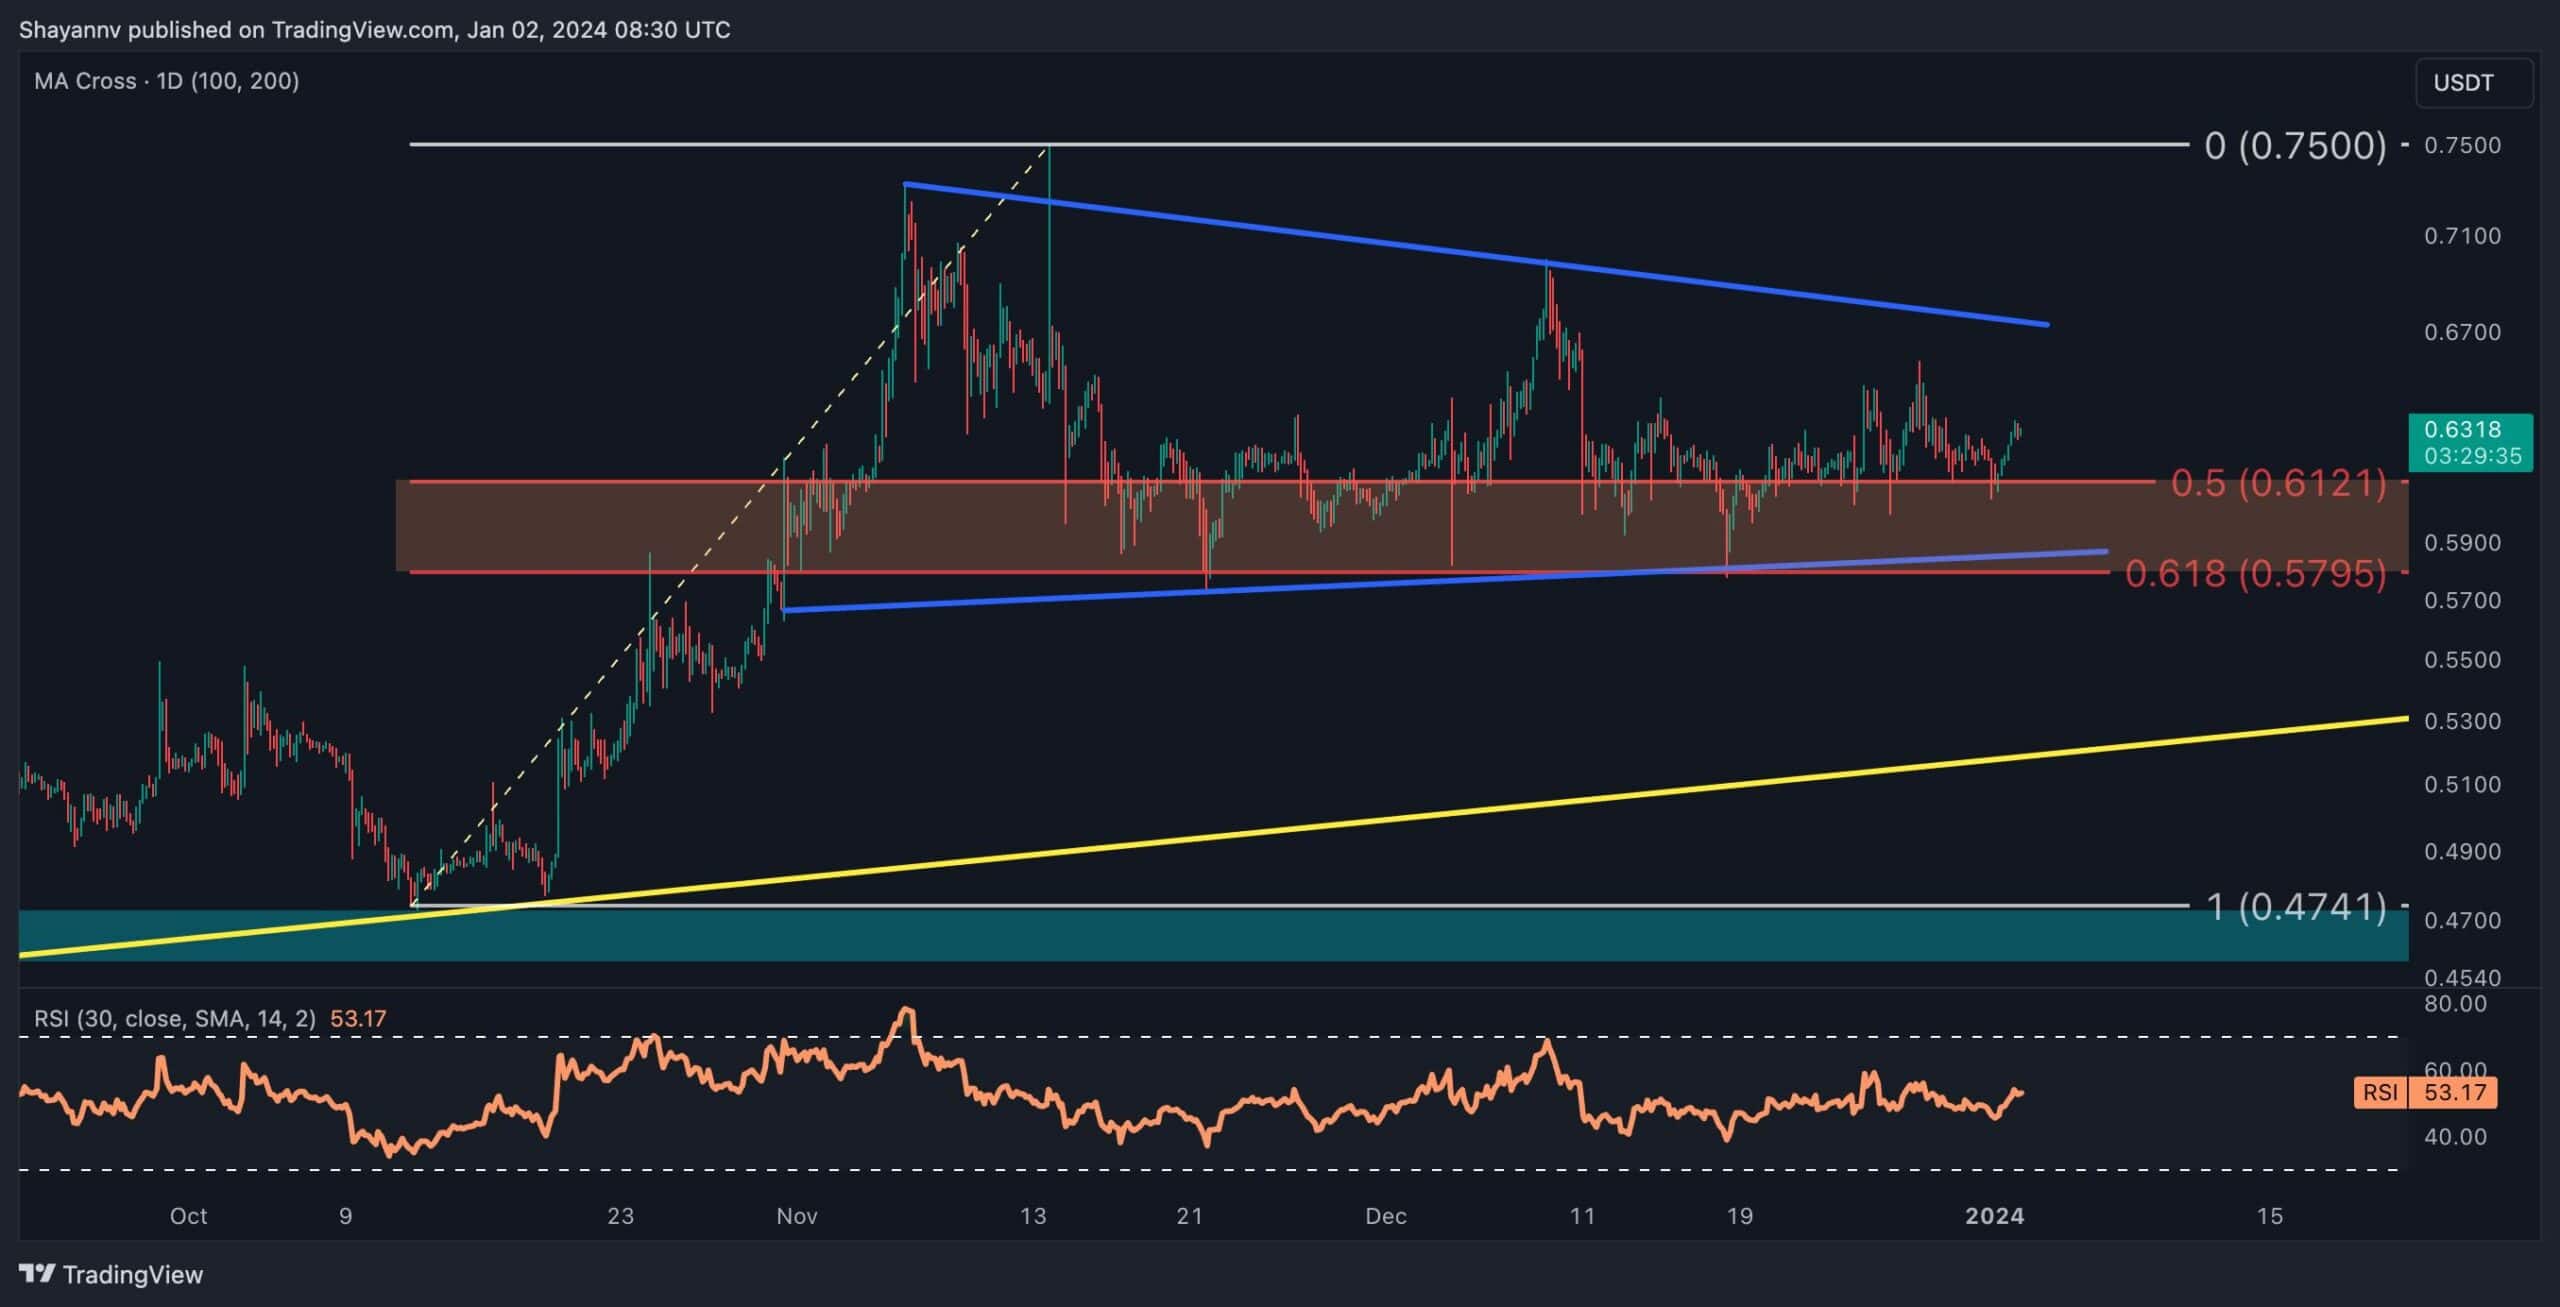
A closer look at the daily chart reveals a robust support region comprising the 100-day and 200-day moving averages, along with the lower boundary of the wedge at $0.58. This level has effectively halted multiple bearish attempts, underscoring the existence of substantial demand. Notably, the recent occurrence of a golden cross, where the 100-day moving average crosses above the 200-day moving average, signals a bullish outlook for Ripple’s long-term prospects.
In this context, as the price approaches the narrowing end of the wedge, a breakout to the upside could initiate a sustained bullish trend, reinstating demand in the market. Conversely, an unexpected breach below the crucial support may trigger a cascading effect, potentially leading to a significant long-squeeze event.
The 4-Hour Chart
A more detailed analysis of the 4-hour chart highlights the significant support region, ranging from the critical 0.5 ($0.61) to 0.618 ($0.58) levels of the Fibonacci retracement. This range continues to act as a robust defense against sellers’ attempts to drive the price lower, contributing to the expansion of Ripple’s sideways consolidation phase.
Importantly, this vital support area aligns harmoniously with the lower boundary of the wedge, further solidifying its role as a resilient barrier against selling pressure.
A potential dip beneath this pivotal support range could indicate an imminent substantial downturn for XRP. However, given recent price movements and market sentiment, the more plausible scenario seems to be a breakout above the wedge pattern. If successful, the market could experience a significant uptrend, targeting the reclamation of the $0.74 resistance threshold.
The post Massive XRP Move Becomes More Likely: What’s the Next Target? (Ripple Price Analysis) appeared first on CryptoPotato.