Massive Bitcoin Volatility Incoming, Crypto Market Like a Coiled Spring According to Glassnode
The cryptocurrency market is calm in the past few weeks, with no considerable movements happening in any direction.
The major exceptions to the lack of volatility seem to be event-driven occasions like on October 14th, when the United States Bureau of Labor Statistics announced the inflation numbers for September. The Bitcoin price went on a rollercoaster, plunging and then skyrocketing within the hour.
Apart from this, though, the market has been rather static. Now, Glassnode – a popular analytics resource – argues that it’s like a coiled spring due for a burst of volatility.
Bitcoin Price Consolidation Continues
Reiterating the above, Glassnode points out that the Bitcoin market continues to consolidate within a fairly tight range and that almost “all of the extreme prices of the weekly range” were reached during a window of just 24 hours.
In response to US inflation data coming in slightly hotter than expectations, BTC prices traded down to $18,338, followed by a quick rally to a high of $19,855, before completing a round trip to the weekly open price.
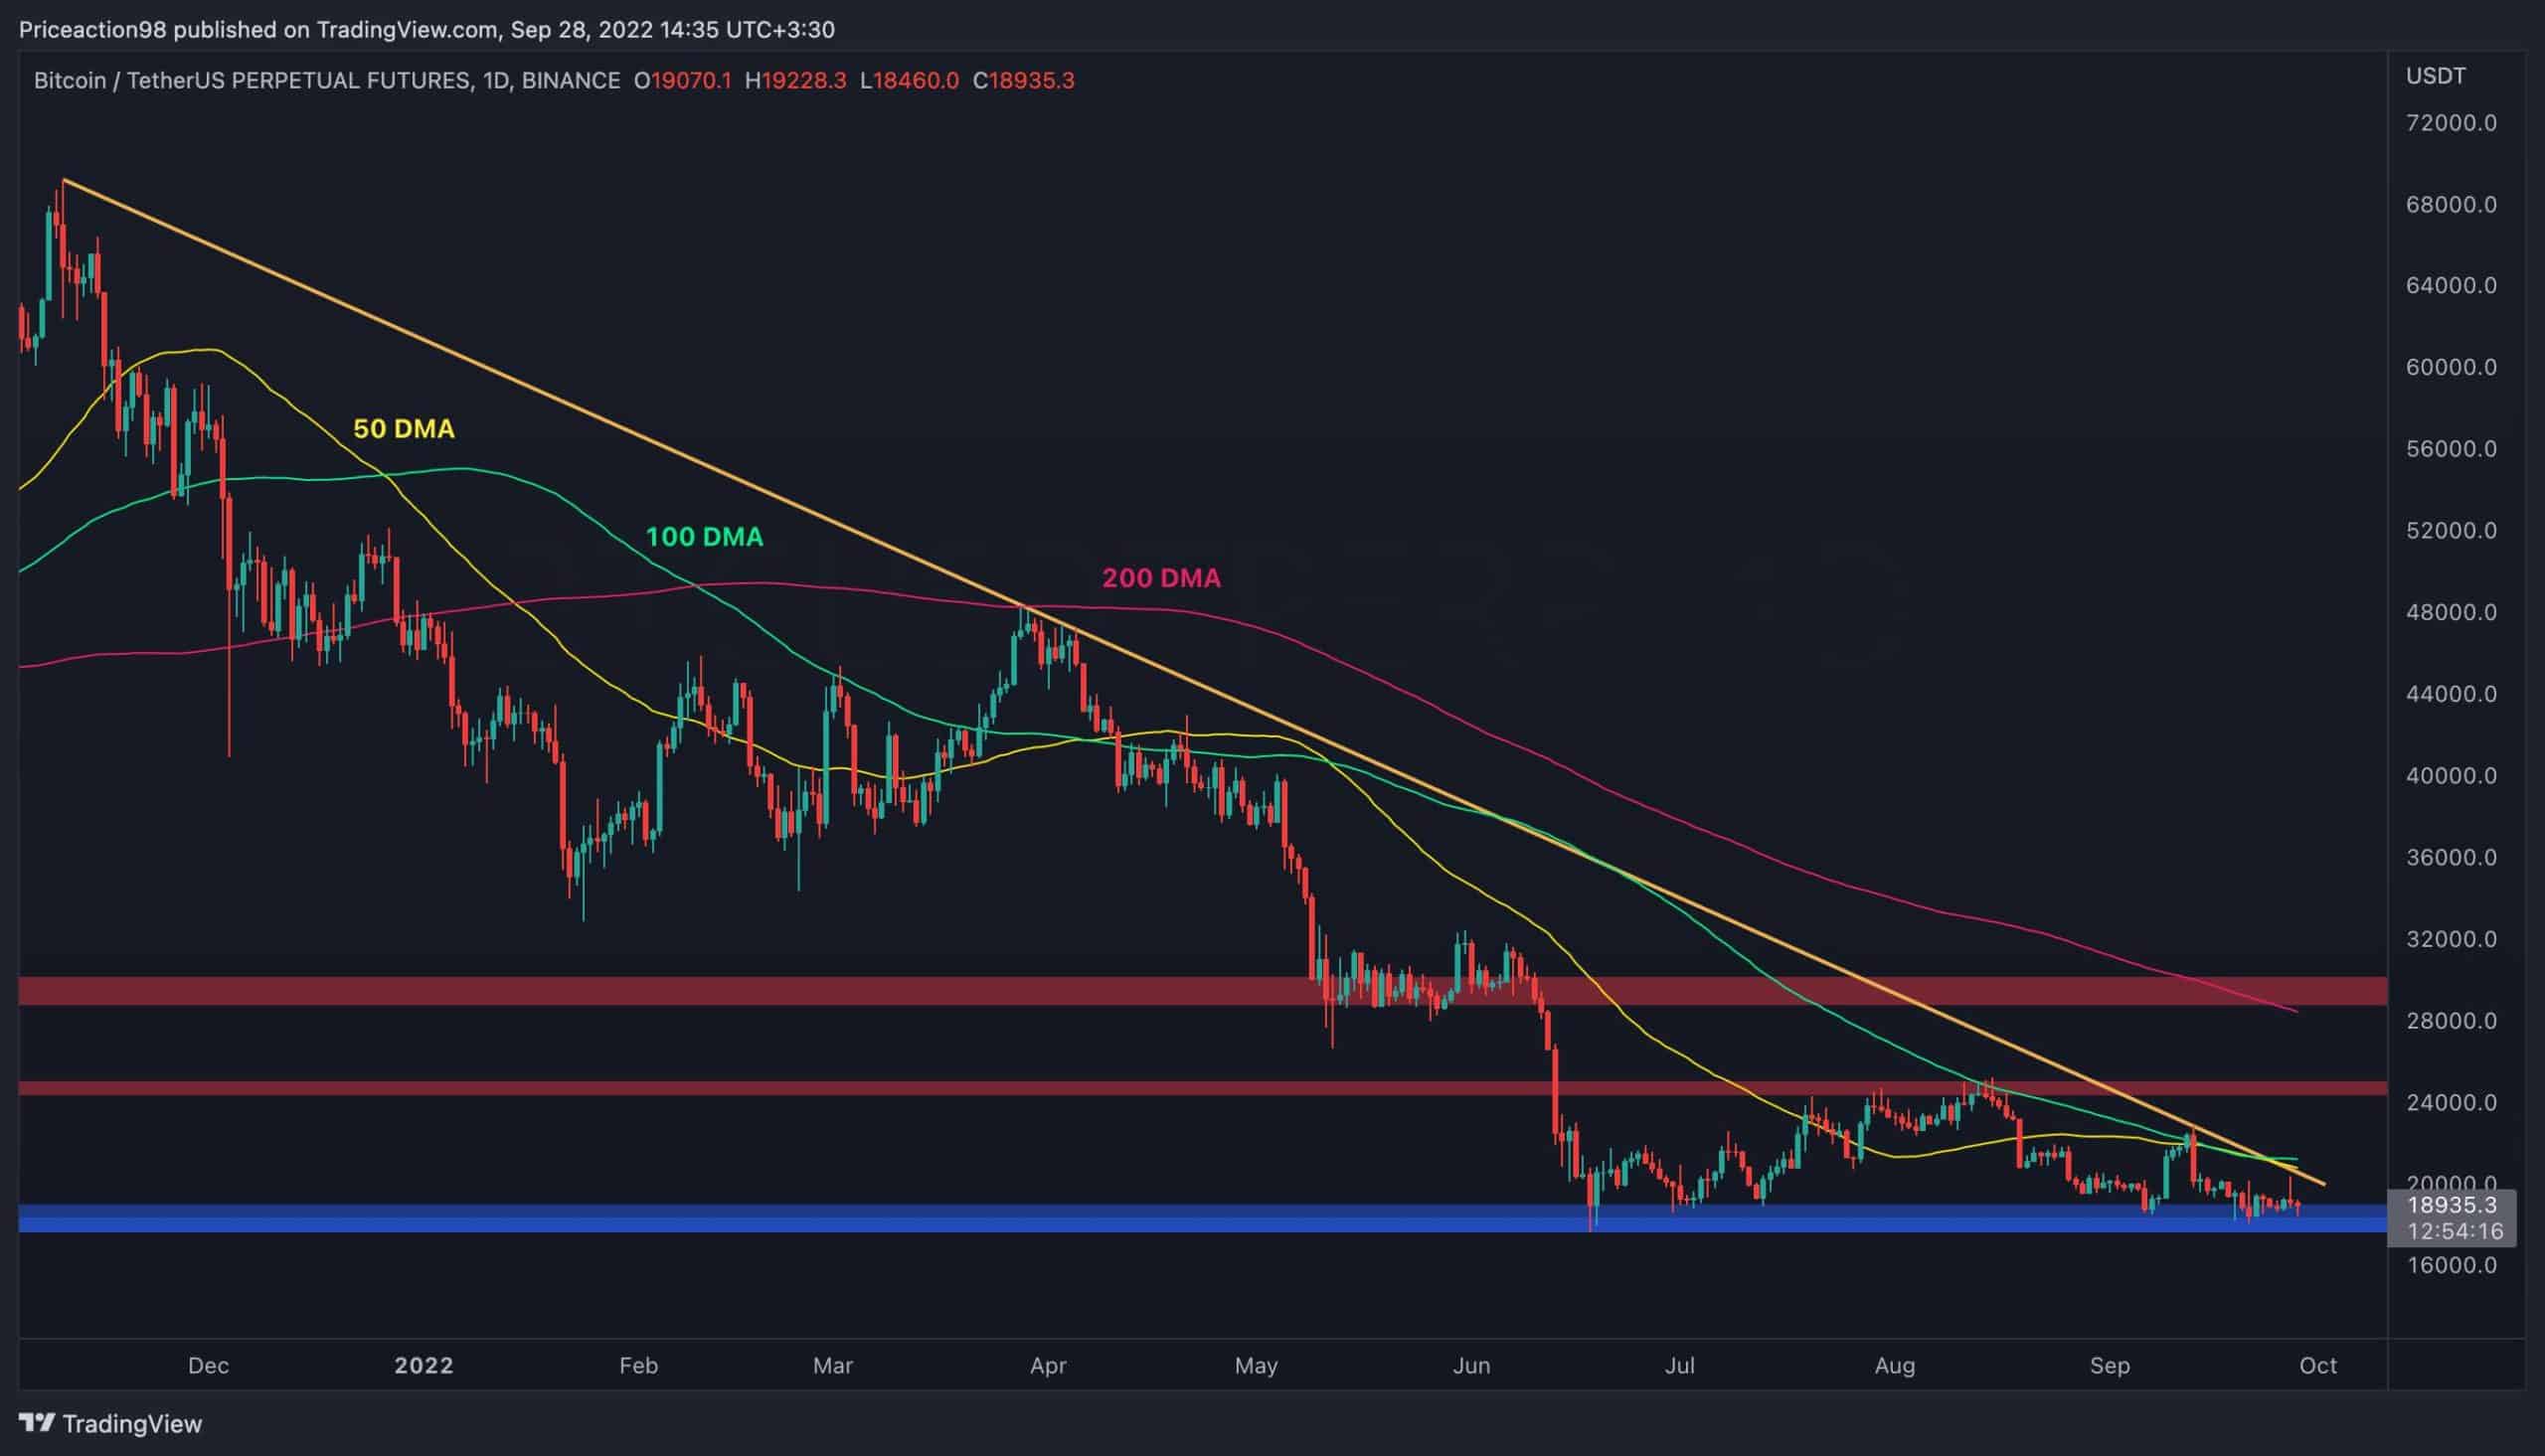
At the time of this writing, the BTC price sits at around $19,594, up 2% on the day and attempting another shot at the critical resistance at $20K.
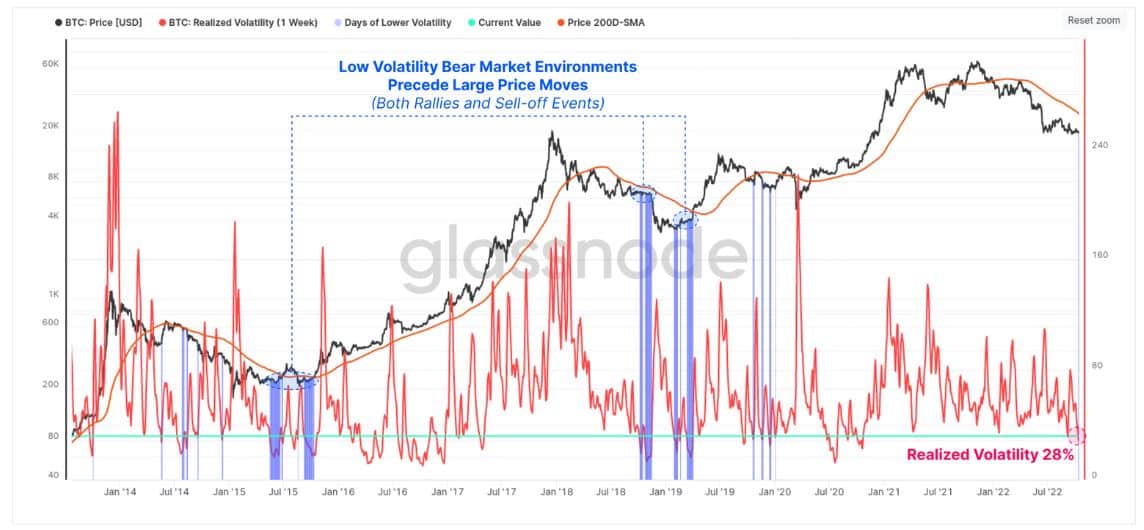
According to Glassnode, it is very uncommon for the BTC market to reach a period of such low realized volatility. Most of the prior instances of the kind were also preceding a highly volatile move.
For example, in the following 1-week realized volatility chart, we can see that when the values of the 1-week rolling volatility tumbled below 28% (current values) in a bear market, this phase almost always preceded significant price moves in both directions.
Other Signs of Incoming BTC Volatility
Relatively similar compression can be seen with another metric – the adjusted spent output profit ratio (aSOPR). It measures the average realized profit/loss multiple for coins that are spent on any given day.
If the value is around 1 in a bull market, this often acts as support because investors tend to increase their positions at around their cost basis. This is usually manifested as a “buy the dip” scenario. On the contrary, if the same value is in a bearish trend, it tends to act as resistance because investors attempt to exit their positions at a cost basis.
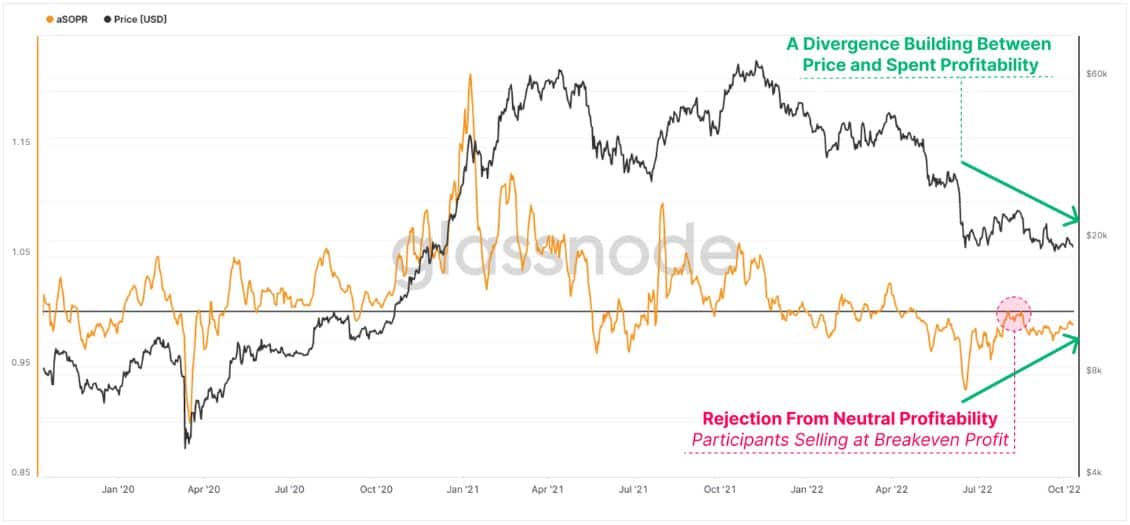
As the weekly average of aSOPR approaches the break-even valu e of 1.0 from below, it is increasingly likely that volatility is on the horizon, either as a breakout, or yet another rejection.
Off-Chain Bitcoin Volatility Also Brewing
Glassnode also points out that volatility also seems to be brewing in the derivatives markets. This is because the options pricing of the short-term implied volatility has already reached an all-time low this week, currently sitting at 48%.
When this happened on several other instances in the past, it had preceded violent moves which often compounded by the deleveraging of DeFi and derivatives markets.
The post Massive Bitcoin Volatility Incoming, Crypto Market Like a Coiled Spring According to Glassnode appeared first on CryptoPotato.

