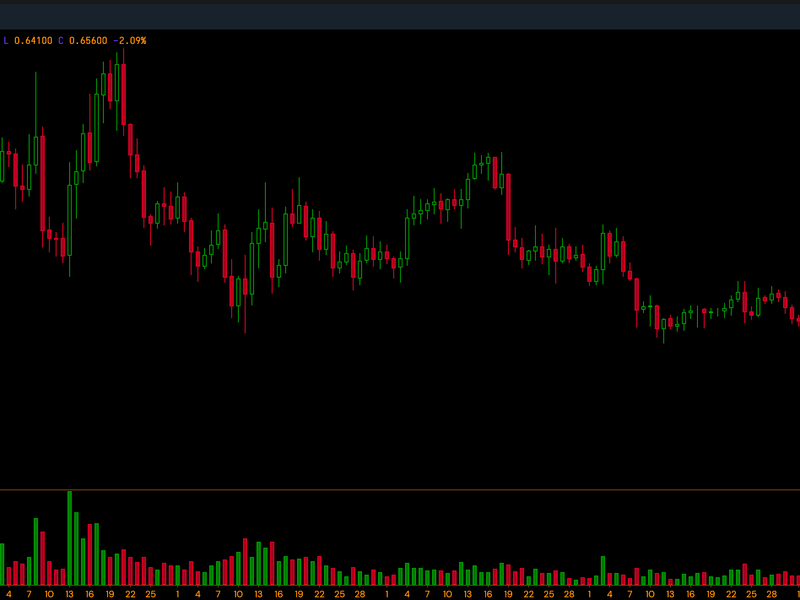
Market Wrap: Bitcoin Rises to $35.8K, Ether Hits New High and DeFi Crosses $28B Locked
The last time bitcoin’s closing price was under $30,000 was Jan. 1, according to CoinDesk 20 data.

Market Wrap: Bitcoin Rises to $35.8K, Ether Hits New High and DeFi Crosses $28B Locked
Bitcoin reversed several days of sideways trading to head higher, ether broke $1,500 for the first time and DeFi’s ecosystem has a record amount of value locked in dollar terms.
- Bitcoin (BTC) trading around $35,824 as of 21:00 UTC (4 p.m. ET). Gaining 6% over the previous 24 hours.
- Bitcoin’s 24-hour range: $33,459-$35,824 (CoinDesk 20)
- BTC above the 10-hour but below the 50-hour moving average on the hourly chart, a sideways signal for market technicians.

Bitcoin’s price is gaining Tuesday, going as high as $35,645 around 10:00 UTC (5 a.m. ET) before dipping somewhat.
“I think we’ll see more interest in bitcoin again if we move solidly above $35,000,” said Chris Thomas, head of digital assets for Swissquote Bank. “On the support side for bitcoin is institutional buying in the low $30,000s.”
Some exhaustion recently in the bitcoin market may have been caused by speculative activity in the stock market.
“So much attention has been on U.S. equities markets as of late, a lot of the mainstream and crypto outlets have been much less focused on driving the formation of opinions of traders and hodlers,” said John Willock, chief executive officer of crypto custody provider Tritum.
Equities on major indexes were all up Tuesday.
In addition to the bullish sentiment keeping stocks buoyant, it should be noted the price per 1 BTC has been able to stay above $30,000 for quite a while.
The last time bitcoin’s closing price was under $30,000, according to CoinDesk 20 data, was on New Year’s Day, when it closed at $29,333. It hasn’t looked back since.

“More than anything else, we should all take the long-term sustained price levels above the 2017 high of $20,000 now over a month as the best possible endorsement of bitcoin being a long-term bullish asset,” added Tritum’s Willock.
“Generally speaking, I think that the market is accepting higher prices while trying to digest the volatility,” noted Neil Van Huis, director of institutional trading at crypto liquidity provider Blockfills.
Bitcoin’s gyrations seem to have subsided somewhat, helped by a very flat weekend into Monday. As of Feb. 1, bitcoin’s 30-day volatility has trended downward; but it is still above 100%, which is quite high. The S&P 500, by comparison, has a 30-day volatility below 20%.

In the options market, traders are expecting a 62% chance of BTC over $32,000, based on their positions for February expirations. They seem to expect a 53% chance of trading over $34,000 and a 44% probability of bitcoin moving higher than $36,000, according to data collected by Skew.

“We have seen good signs in the option markets that participants are still valuing and pricing the market for higher in the near term,” added Blockfills’ Van Huis.
Ether hits new price zenith, crypto locked in DeFi at all-time high
Ether (ETH), the second-largest cryptocurrency by market capitalization, jumped Tuesday, trading around $1,526 and climbing 14.4% in 24 hours as of 21:00 UTC (4:00 p.m. ET) – a fresh all-time high, according to CoinDesk 20 data.
The total value locked, or TVL, of crypto in U.S. dollar terms within decentralized finance (DeFi) is also hitting a brand-new high, going over $28 billion locked and at $28.8 billion as of press time, according to data aggregator DeFi Pulse.

The amount of ether locked in DeFI is up, at over 7.3 million ETH as of press time. The rise in the price of ether locked in DeFi doesn’t hurt.

Meanwhile, the amount of bitcoin locked is heading upward, with the TVL at 45,632 BTC as of press time.

Jun Dam, a smart-contract developer who has written code on the Ethereum and Tron platforms, noted that many decentralized exchanges have numerous pairs with ETH, and speculates traders may be selling some of their stash for DeFi tokens. “It seems like total DEX volume has increased significantly in 2021,” Dam told CoinDesk.
“DeFi is definitely the flavor,” concurred Swissquote’s Thomas. “There’s still good value out there if you consider the possibility that more people will move to DEXs in the next 12 months [and that] arguably the DEXs are still undervalued.”
Other markets
Digital assets on the CoinDesk 20 are mostly green Tuesday. Notable winners as of 21:00 UTC (4:00 p.m. ET):
- cardano (ADA) + 16%
- litecoin (LTC) + 9.8%
- bitcoin cash (BCH) + 5.1%
Notable losers:
- xrp (XRP) – 10.5%
- omg network (OMG) – 3.3%
- cosmos (ATOM) – 2.8%
Commodities:
- Oil was up 2.5%. Price per barrel of West Texas Intermediate crude: $54.85.
- Gold was in the red 1.3% and at $1,835 as of press time.
- Silver is dropping, down 8.3% and changing hands at $26.48.
Treasurys:
- The 10-year U.S. Treasury bond yield climbed Tuesday to 1.100 and in the green by 0.47%.


