Mantra (OM) Price Hits a New ATH: Further Rally in the Cards?
TL;DR
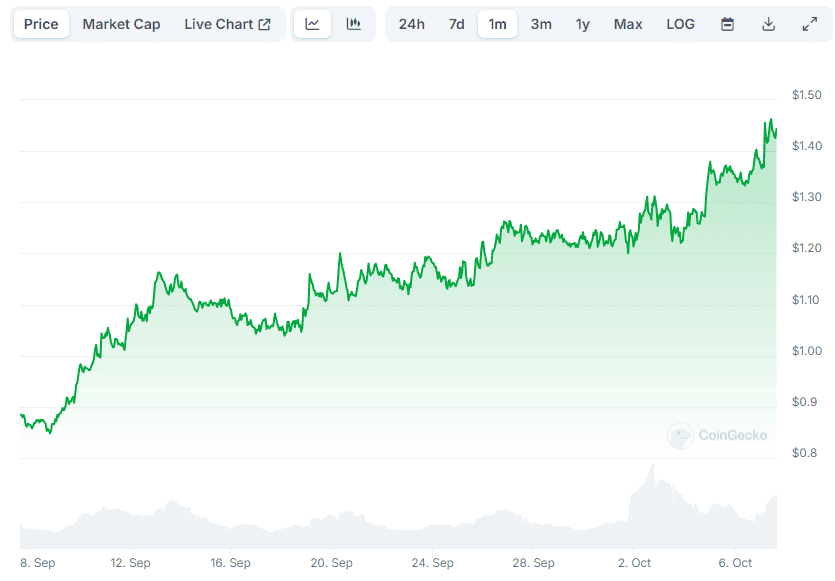
- Mantra (OM) surged over 60% in the past 30 days, hitting an all-time high of $1.50 with analysts predicting a further jump.
- On-chain metrics suggest continued gains, but the RSI indicates it may be overbought, signaling a possible correction.

New Peak for OM
Most of the leading cryptocurrencies have experienced severe ups and downs over the past several weeks. Bitcoin (BTC), for instance, fell to $60,000 at the beginning of October and later rebounded to its current $63,000 (per CoinGecko’s data).
There are a few digital assets, though, whose prices have gone predominantly up as of late. One evident example is Mantra (OM), which has jumped by over 60% monthly. Earlier today (October 7), it hit a new all-time high of almost $1.50, whereas its market capitalization surpassed $1.2 billion.

The token’s achievement caught the eye of multiple industry participants. The popular X user IBCIG claimed OM’s momentum is “truly unstoppable,” expecting a further rally to $2.
“With its purpose-driven tokenomics and a robust Layer 1 foundation, it is by far among the best RWA projects in my portfolio,” they added.
Daan Crypto Trades and Token Sherpa chipped in, too. The former said OM performed “incredibly strong during all the chaos in the past few weeks/months,” while the latter thinks the new peak is just the beginning of a major bull run.
On-Chain Metrics Flash the Buy Signal
Over a dozen important metrics suggest that OM’s bull run is nowhere near its end. One of those is the Momentum Indicator (MOM), which measures the asset’s rate of change and compares the current valuation with the price from previous periods. As of the moment, it is set at around 0.2, presenting a potential buying opportunity.
The Simple Moving Average (on a 10-day scale), the Exponential Moving Average (on a monthly basis), and the Hull Moving Average also indicate possible gains in the near future.
One of the very few metrics hinting at a potential correction is the Relative Strength Index (RSI). The momentum oscillator has surpassed a ratio of 75, entering overbought territory. This suggests that OM might be overvalued, and a pullback could occur.
The post Mantra (OM) Price Hits a New ATH: Further Rally in the Cards? appeared first on CryptoPotato.


