Make or Break for ETH as $1.8K Level Put to the Test (Ethereum Price Analysis)
Ethereum’s price has been slowly dropping over the past few weeks, approaching a significant support level. Things will get interesting soon, as the market’s reaction to this level would likely determine the price action in the next few weeks.
Technical Analysis
By: Edris
The Daily Chart:
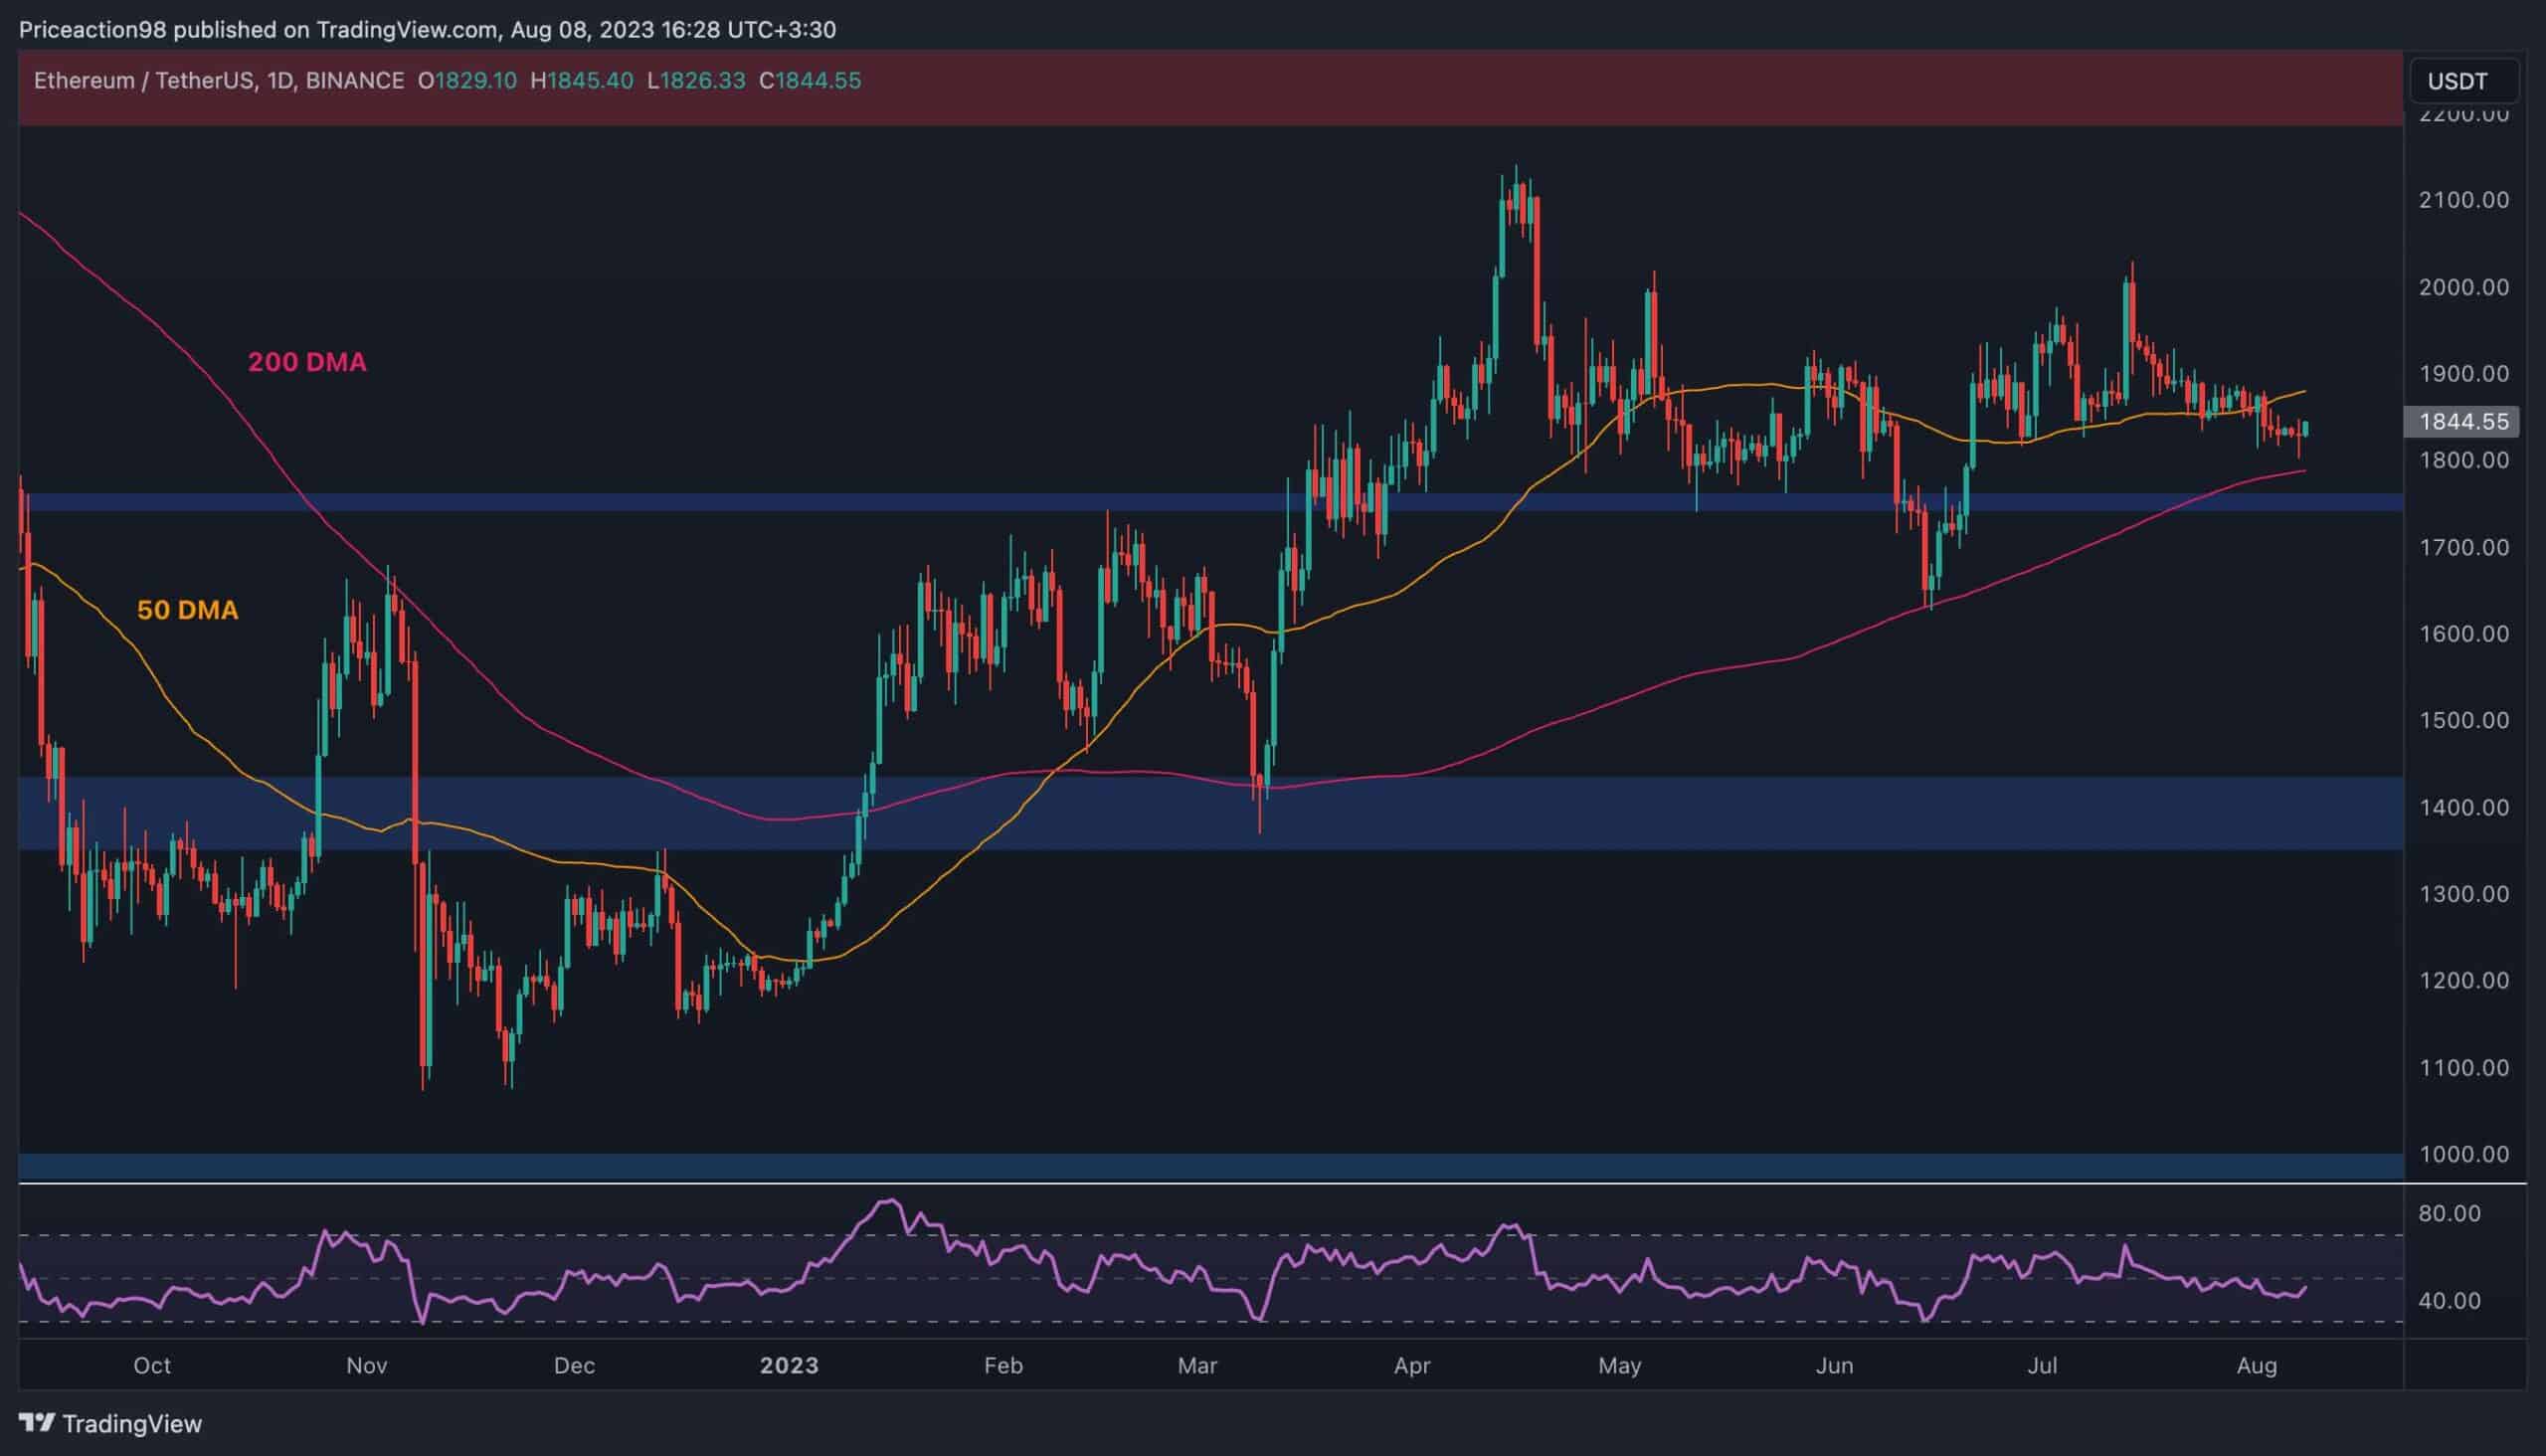
On the daily timeframe, the ETH price has been declining since getting rejected from the $2,000 psychological level.
The 50-day moving average has also been broken to the downside around the $1,900 mark. Currently, the price is moving toward the 200-day moving average located near the $1,800 level. The $1,750 support zone is also nearby, adding to the significance of this area.
A rebound could result in a rally toward the $2,000 level and probably higher. On the other hand, a breakdown of the mentioned support zone can lead to a rapid drop to the $1,400 area in the short term. Yet, judging by the lack of bearish momentum in the recent decline, a rebound and rally seem more likely.
The 4-Hour Chart:
The recent price action is much clearer in the 4-hour timeframe. As the chart depicts, the cryptocurrency has been oscillating inside a descending channel for the past few weeks. Currently, ETH is moving towards the higher boundary of the pattern, as the $1,820 short-term support has held strongly.
The RSI indicator has also risen above the 50% threshold, indicating that the buyers are once again in control. So, a bullish breakout from the channel and an uptrend toward the $1,920 resistance and even higher toward the $2,000 area might become possible in the coming days if things do not take an unexpected turn.

Sentiment Analysis
By: Edris
Ethereum Funding Rates
Ethereum’s price action has yet to show any indication of moving higher or lower.
This chart represents the Ethereum funding rates. The metric determines whether long traders or short sellers are dominant. Positive values are usually associated with bullish sentiment, while negative ones indicate bearish sentiment.
It is evident that after a few weeks of positive values, funding rates turned extremely negative yesterday. While this is generally a sign of bearish sentiment, it could lead to positive consequences if the metric quickly returns below 1.
Negative funding rates also increase the chance of a short liquidation cascade, which could lead to a significant rally and push the price above the $2,000 level once more.

The post Make or Break for ETH as $1.8K Level Put to the Test (Ethereum Price Analysis) appeared first on CryptoPotato.