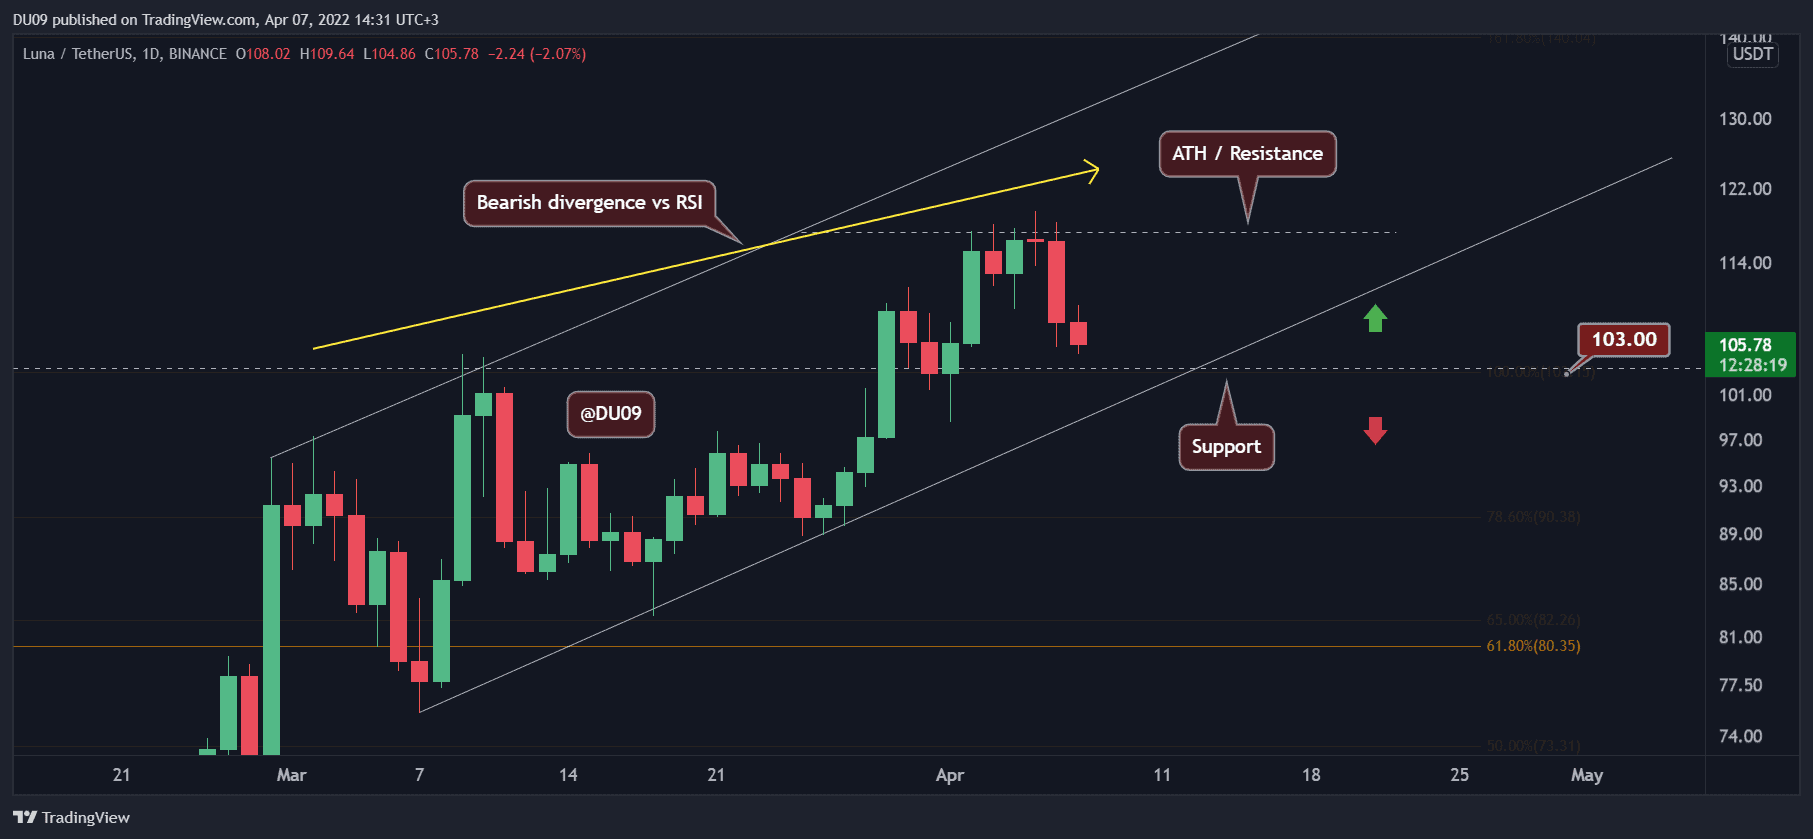
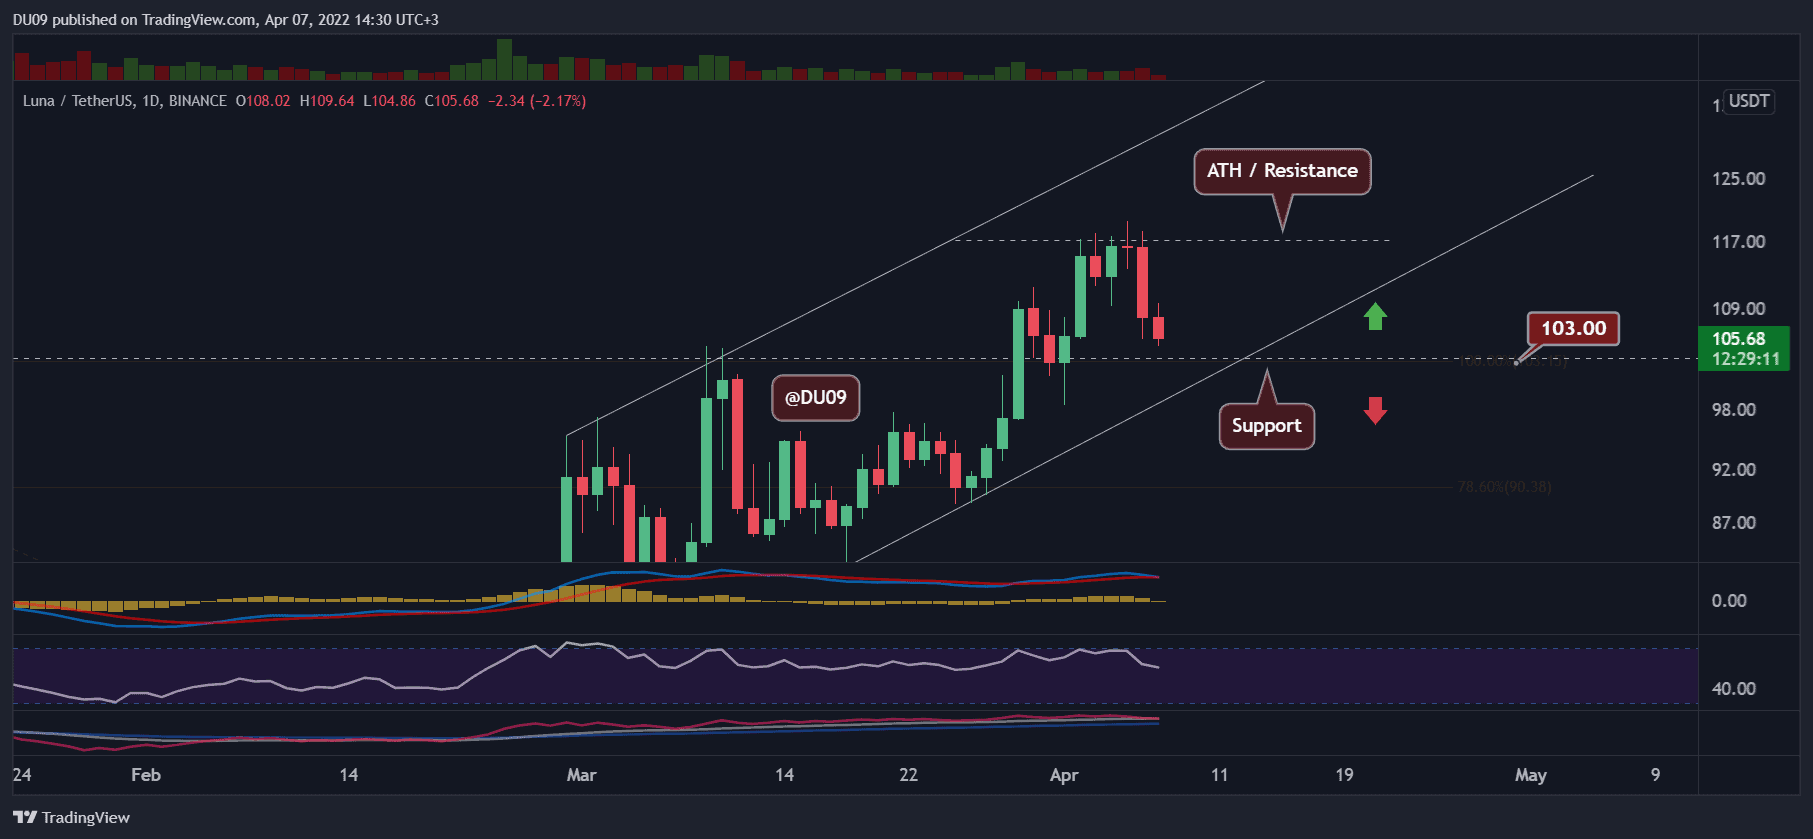
Luna Price Analysis: Bearish Cross Looms as LUNA Dips 6% Daily
Key Support level: $103, $90
Key Resistance level: $120
After an impressive rally, LUNA managed to set a new all-time high at $119.55 (Binance). The price is now found in a correction after bears took over the market yesterday. This has turned the $120 into resistance, and the next key support level will be found at $103 and $90.
Technical Indicators
Trading Volume: The volume for Luna remains constant and sustained. The only problem is that this volume has turned into a seller’s market in the past three days – closing in the red.
RSI: The RSI did not reach the overbought levels during this last rally and has made a large bearish divergence on the daily chart compared to the rally in early March. This may signal that a more significant correction is starting.
MACD: The daily MACD is dangerously close to a bearish cross. If confirmed, it would be important to remain cautious.
Bias
The current bias on Luna is bearish based on the indicators and the latest price action.
Short-Term Prediction for Luna Price
Luna has formed a large bearish divergence on the RSI, and with the MACD about to turn as well, it is very hard to expect the price to move above $120 in the near term.