Long-Term Holders and Whales Continue Accumulating Despite the Bitcoin Crash (Research)
Crypto markets experienced the sharpest drops since July of 2021, correcting as much as 52%. While the macro bear scenario is still very much in play, some critical on-chain indicators are showing how long-term investors remain unfazed by this news, and whales continue to accumulate.
Bitcoin’s Ownership Through the Dip
The data from IntoTheBlock classifies as hodlers all addresses that have been holding an asset for a weighted average time of at least one year. Growing long-term investors suggest the belief that an asset will retain or increase its value over time, which is a key characteristic of store of value assets.
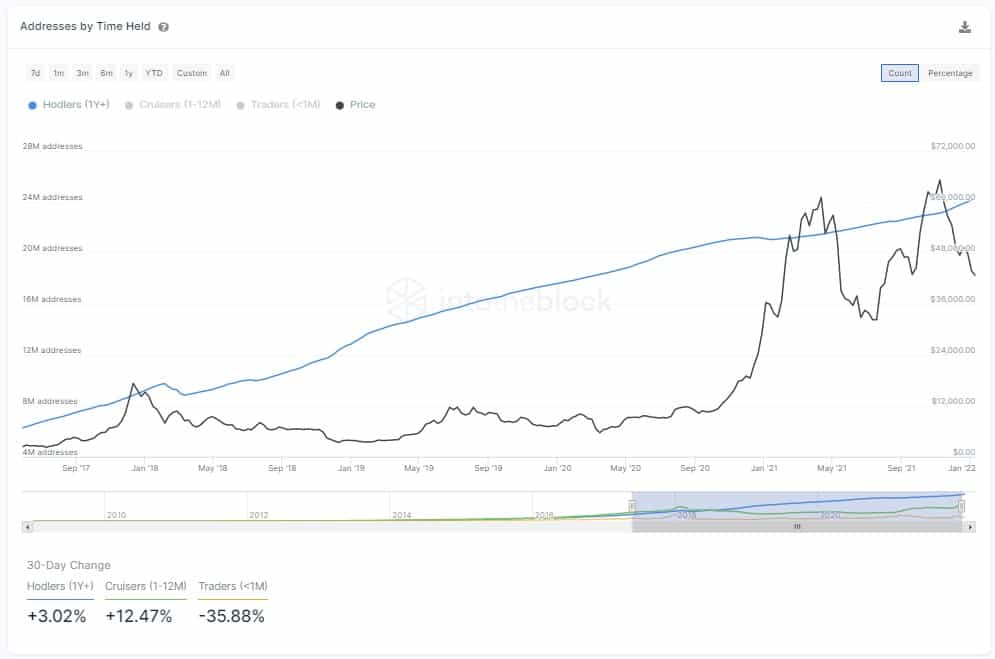
In Bitcoin’s case, the number of hodlers has grown consistently regardless of price volatility, managing to increase through the recent correction and even through the steep crash experienced in March 2020.
Even as the price of Bitcoin suffered a prolonged drawdown since November, just in the last 30-days, the number of hodlers increased by 3.02%. The above statement is further reaffirmed when analyzing the percentage of umoved Bitcoin.
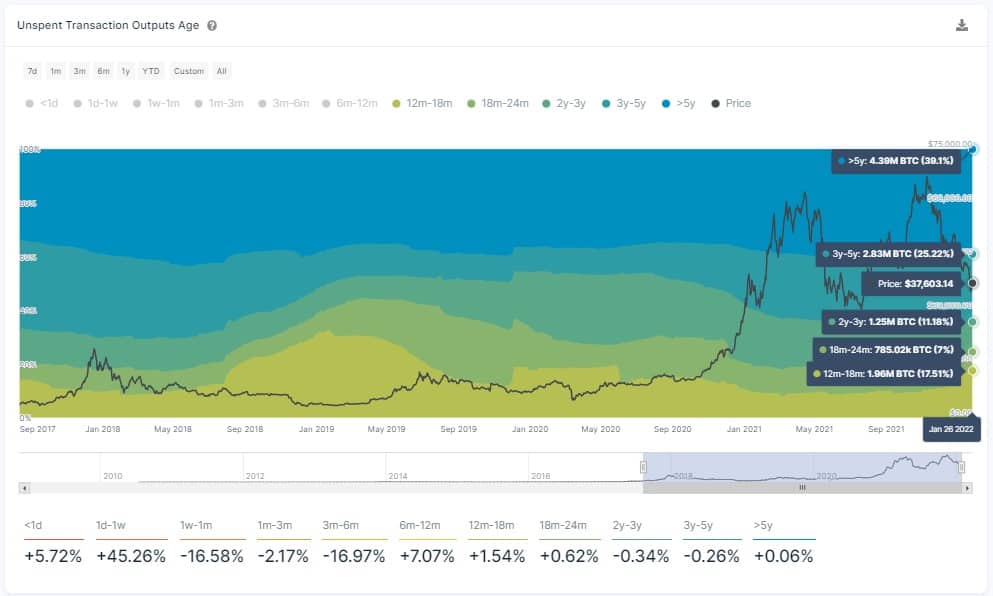
The Unspent Transaction Outputs Age indicator measures the volume of transactions being created and classifies these by time frames. By doing so, the UTXO Age Indicator segments the number of tokens (e.g. the number of BTC in the case of Bitcoin) according to the time it has been since they last moved from one address to another.
Recently, the amount of the BTC circulating supply that hasn’t been moved for at least 12 months is approaching 60%, which is higher than we experienced during the March 2020 crash.
Big Wallets in Accumulation Mode
And as it becomes clear that holders remain unfazed by these price movements, the next question to be asked is, are they accumulating?
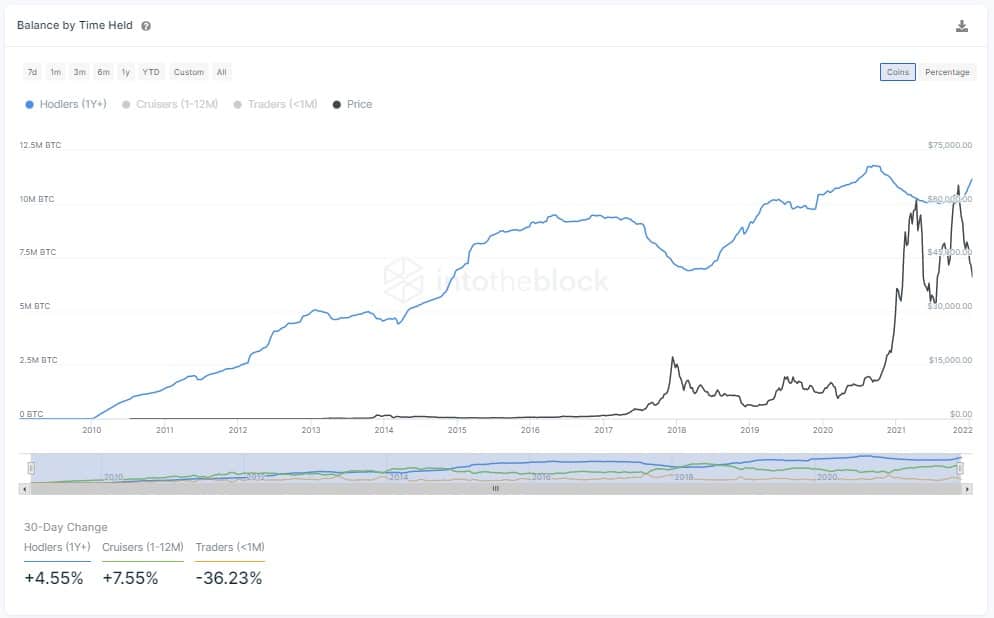
The graph above shows the balance of Bitcoin held by Hodlers – passive investors that have held the asset for more than one year. This tracks the accumulation patterns during the different stages of the Bitcoin cycle.
- While the majority of the retail buyers got scared during the March 2020 crash, these addresses accumulated roughly 1 million BTC until October 2020, back when the rally started.
- They slowly sold a small portion of their holdings during the early 2021 rally, and they have now started to accumulate again as Bitcoin started to drop in November.
- In just 30 days, these addresses increased their BTC holdings by 4.55%
As these holders increased their holdings, the accumulation pattern is also evidenced by the growing volume held by addresses with 1k-10k BTC.
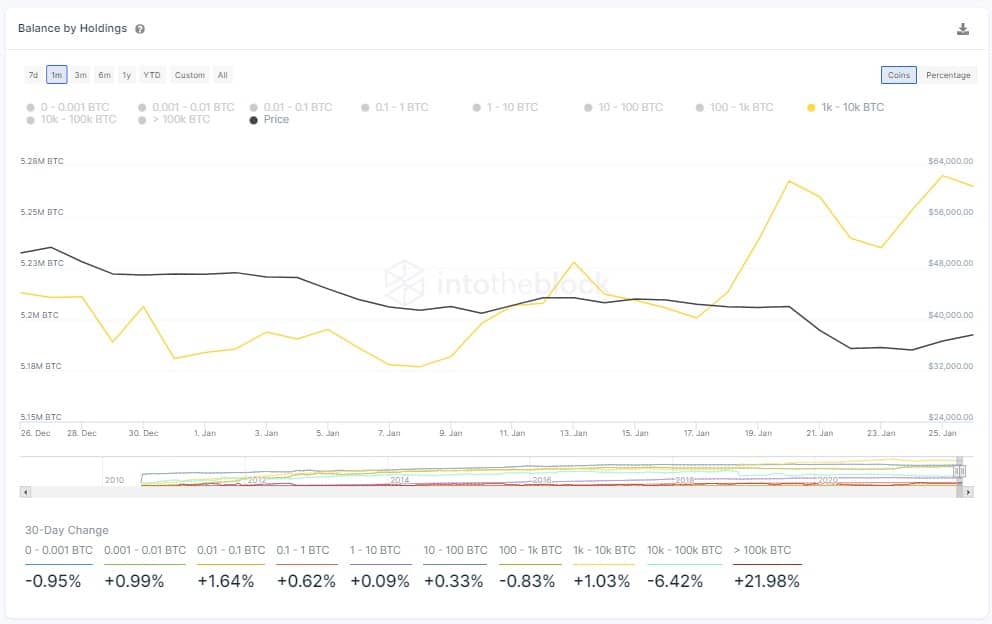
- Addresses with over 1k-10k BTC are evidently institutional players or whales in crypto parlance
- These addresses tend to lower their holdings following large rallies (as was the case in March and October) and patiently wait to buy at lower levels (like in May and over the past few weeks)
- The volume held by these addresses increased by 1.03% in just 30 days, increasing their holdings by 5.26m BTC.
While market downturns are common, savvy investors should keep an eye on key indicators to spot fundamental value emerging from recent and upcoming developments.
This research post was written for CryptoPotato by analyst Daniel Ferraro on behalf of IntoTheBlock.


