Long-Term Bitcoin Holders Boost Their Stash as BTC Prices Decouple From Nasdaq
:format(jpg)/s3.amazonaws.com/arc-authors/coindesk/31d39a34-26a1-4e78-a5da-d5cf54a9d695.png)
Omkar Godbole is a Co-Managing Editor on CoinDesk’s Markets team.
Long-term bitcoin (BTC) investors are accumulating tokens as the largest cryptocurrency’s price declines, decoupling it from the continued uptick in Wall Street’s tech-heavy index Nasdaq.
Blockchain analytics firm Glassnode’s long-term holder net position change indicator, which tracks the 30-day change in the net amount of BTC entering or exiting exchange wallets that tend to hold coins for over six months, flipped positive in early April and has surged in the past four weeks.
The feature image shows net accumulation is currently happening at the fastest pace since October 2021. That indicates that investors view bitcoin’s recent weakness as a typical bull market breather.
“Long-term BTC holders are adding to their positions, implying that investors view the recent pause in price movement as an opportunity to acquire more,” Q9 Capital, a crypto investment platform, said in an email, referring to the surge in the net position change metric.
Glassnode defines long-term holders as wallets holding onto their coins for at least 155 days without selling or moving them.
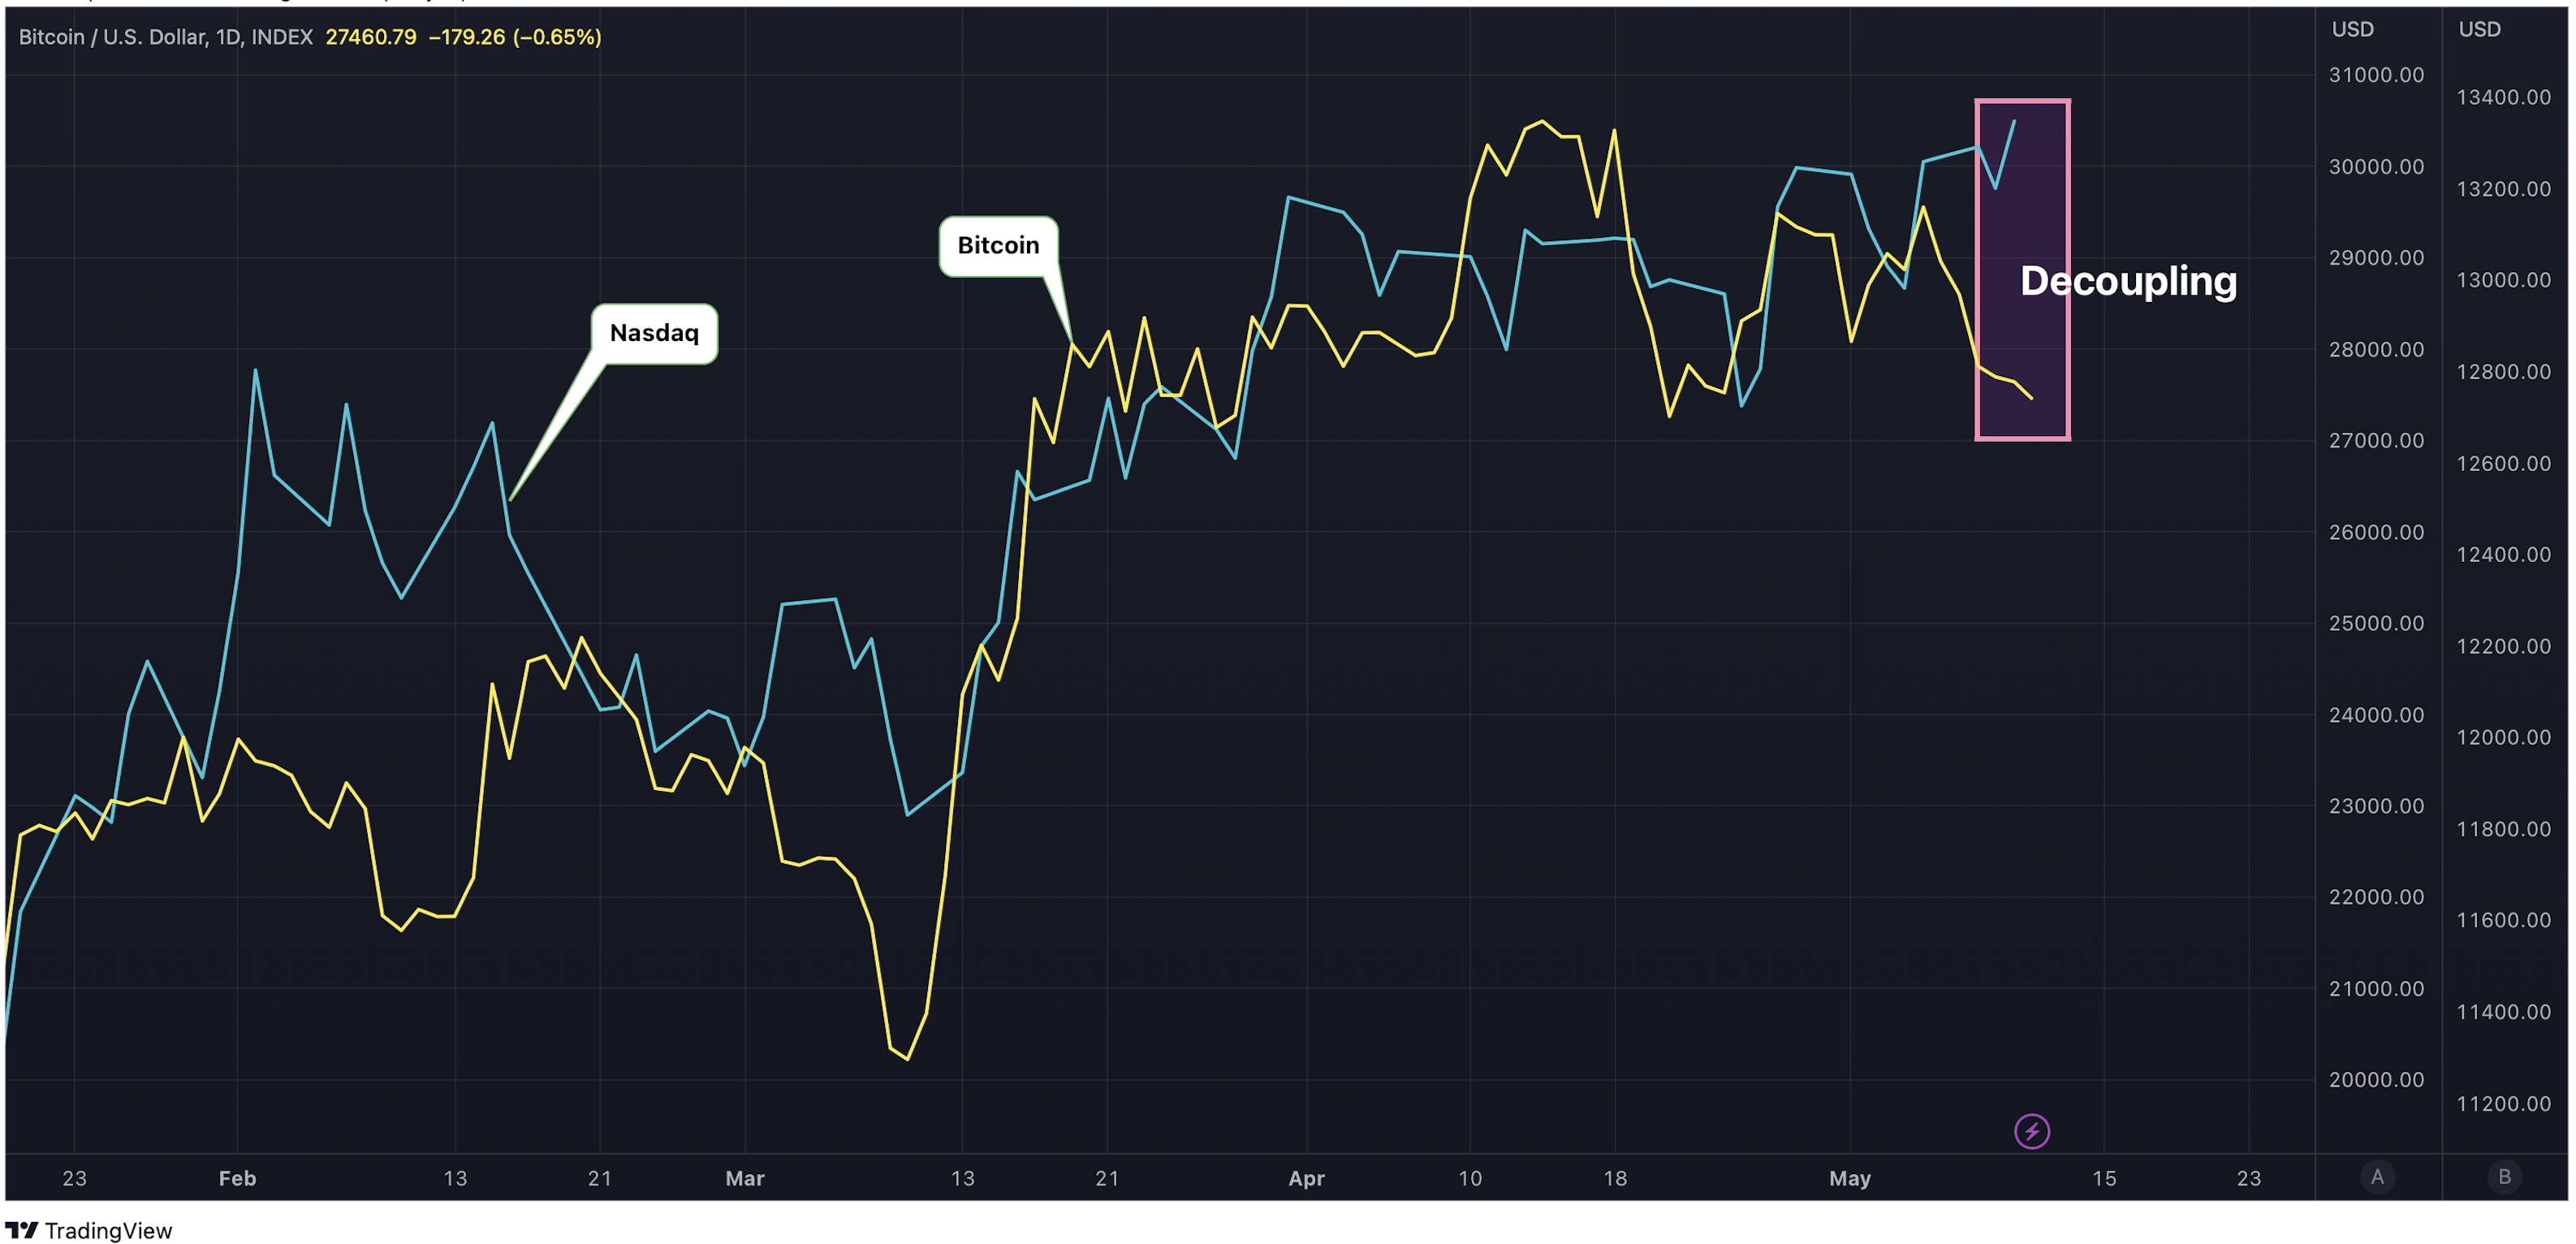
Bitcoin crossed above $31,000 on April 14, hitting the highest since June 2022, per CoinDesk data. Since then, the cryptocurrency’s price has dropped by 12% to $27,500, while Nasdaq has risen by over 2% since mid-April. The Nasdaq-to-S&P 500 ratio, which bitcoin has closely followed in the past, has also increased by over 2% during that time period.
The divergence is a cause of concern for bitcoin bulls, according to Matrixport’s Research and Strategy Head Markus Thielen.
“Based on the relationship with tech stocks (Nasdaq), Bitcoin should now have been above $30,000, and the fact that this is not the case should caution any short-term traders,” Thielen said in a note to clients. “This decoupling could start a more significant divergence between the two.”
“Many equity investors have expected that a U.S. recession was imminent, only to be disappointed as tech stocks continue to rally. Those shorts need to be covered. Unfortunately, Bitcoin does not have large outstanding shorts that could be squeezed – hence the potential divergence between Nasdaq and Bitcoin,” Thielen added.

Bitcoin has recently decoupled from the Nasdaq index. (TradingView) (TradingView)
Edited by Parikshit Mishra.
DISCLOSURE
Please note that our
privacy policy,
terms of use,
cookies,
and
do not sell my personal information
has been updated
.
The leader in news and information on cryptocurrency, digital assets and the future of money, CoinDesk is a media outlet that strives for the highest journalistic standards and abides by a
strict set of editorial policies.
CoinDesk is an independent operating subsidiary of
Digital Currency Group,
which invests in
cryptocurrencies
and blockchain
startups.
As part of their compensation, certain CoinDesk employees, including editorial employees, may receive exposure to DCG equity in the form of
stock appreciation rights,
which vest over a multi-year period. CoinDesk journalists are not allowed to purchase stock outright in DCG
.
:format(jpg)/s3.amazonaws.com/arc-authors/coindesk/31d39a34-26a1-4e78-a5da-d5cf54a9d695.png)
Omkar Godbole is a Co-Managing Editor on CoinDesk’s Markets team.
Learn more about Consensus 2024, CoinDesk’s longest-running and most influential event that brings together all sides of crypto, blockchain and Web3. Head to consensus.coindesk.com to register and buy your pass now.
:format(jpg)/s3.amazonaws.com/arc-authors/coindesk/31d39a34-26a1-4e78-a5da-d5cf54a9d695.png)
Omkar Godbole is a Co-Managing Editor on CoinDesk’s Markets team.


