Litecoin’s Extraordinary Week: Following 30% Weekly Gains, Litecoin (LTC) Price Analysis Feb.13
Litecoin has seen an impressive price surge throughout the past week totaling over 31%, making it the strongest performing cryptocurrency in the top 10 over the stated period.
Some of the fundamental reasons include the partnership with Beam on implementing the Mimblewimble protocol.
Litecoin is now trading at a price of around $43.70 and currently holds a market cap value of $2.60 billion as the cryptocurrency positions itself into the 5th position of the largest cryptos by market cap.
Some proportions before we start the analysis: the veteran project has seen a price fall totaling 12% over the past 90 days as it now trades at a value that is 88% lower than its all-time high price.
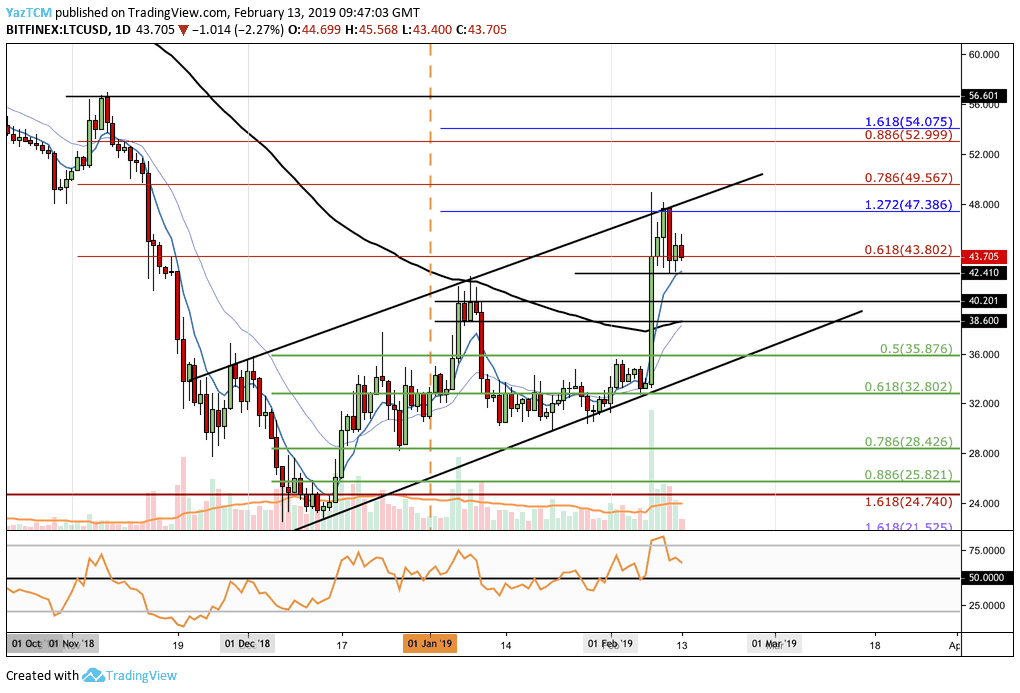
Looking at the LTC/USD 1-Day Chart:
- We can see that the Litecoin surge had met resistance at a medium termed 1.272 Fibonacci Extension level (marked in blue) located at $47.38.
- The coin has now established an ascending price channel that had started forming since the beginning of December 2018.
- LTC/USD is now trading below support at the bearish .618 Fibonacci Retracement level (marked in red) located at $43.80.
- From Below: nearest support is located at the $42.41, $40.20 and $38.60 levels.
- Below the $37 range, we can expect next support at the short term .5 Fibonacci Retracement level (marked in green), located at $35.87.
- This is followed with more support at the lower boundary of the mentioned ascending price channel.
- From above: Nearest resistance lies at the previous medium termed 1.272 Fibonacci Extension level (marked in blue) located around $47.38.
- Above $48, the next resistance level lies at the bearish .786 Fibonacci Retracement level (marked in red) located at $49.56. The last is followed by the $50 mark and the upper boundary of the ascending price channel.
- The RSI indicator has recently reversed from overbought conditions but remains above the 50 handle which indicates that the bulls remain in control of the current market momentum.
- Litecoin daily volume remains high above the $1 billion mark over the past 24 hours of trading.
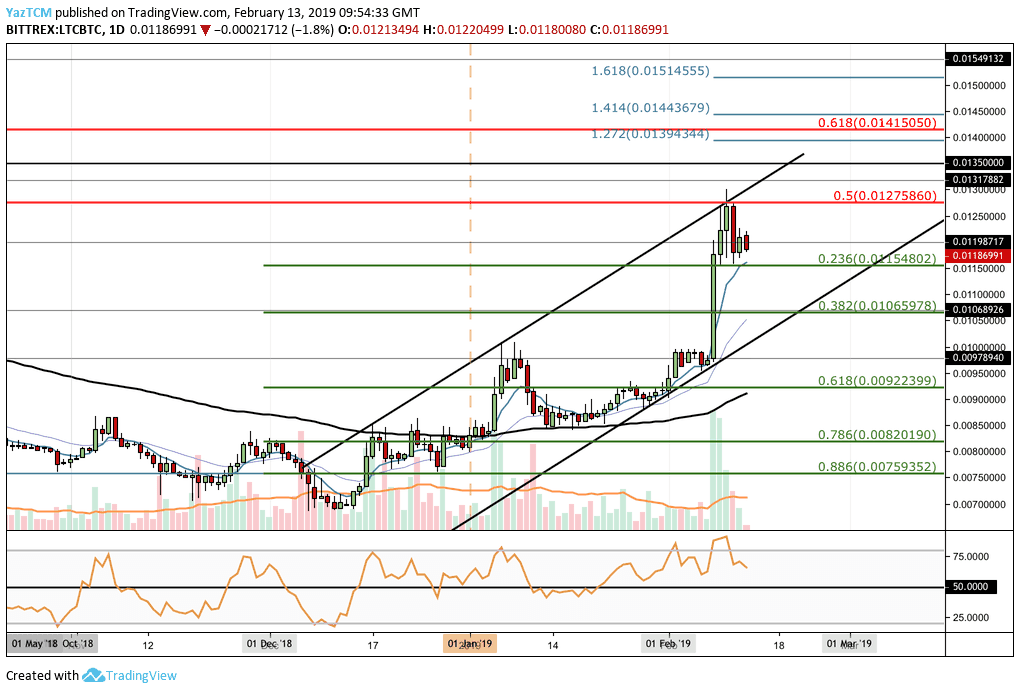
Looking at the LTC/BTC 1-Day Chart:
- LTC/BTC has also established a, slightly steeper, ascending price channel.
- The coin has recently reached resistance at the bearish .5 Fibonacci Retracement level (marked in red) at 0.012759 BTC and has rolled over and fallen.
- From Below: the short term .236 (0.011548 BTC) and .382 (0.0106597 BTC) Fibonacci Retracement levels (marked in green).
- Next support is at 0.0106597 BTC resistance turned support, stretching back to August 2018.
- Another support lies at the lower boundary of the ascending price channel.
- From Above: at the next resistance lies at0125 BTC followed by resistance of the bearish .5 Fibonacci Retracement level (marked in red) located at 0.012758 BTC.
- The next level is 0.013 BTC, then higher resistance is located at 0.013178 BTC and 0.0135 BTC.
- A short term 1.272 Fibonacci Extension level (marked in turquoise) located at 0.01394 BTC will provide higher resistance.
- The RSI has also rolled over from overbought conditions but remains above the 50 levels as bulls remain in control of the market momentum.
- The trading volume for LTC/BTC has decreased over the previous three
The post Litecoin’s Extraordinary Week: Following 30% Weekly Gains, Litecoin (LTC) Price Analysis Feb.13 appeared first on CryptoPotato.