Litecoin Price Analysis: LTC Surges Ahead of Halving – Can It Break-Up $140?
Litecoin has continued its bullish price run, increasing by a further 9.22% over the previous 24 hours of trading to bring the price up to $140. Litecoin now marks a 39% price hike over the past 30 contributing to an impressive 143% price explosion over the past 3 months.
LTC has been surging over the past few weeks as traders start to load up their wallets before the Litecoin block halving occurs. Scheduled around 54 days from now, the event will reduce the supply entering the market from 25 Litecoin per block to 12.5 Litecoin per block. The reduced supply should, in theory, increase the cryptocurrency’s price if the demand for it remains the same or increases. However, considering that the coin is surging, the market may already be pricing in the block halving as we speak.
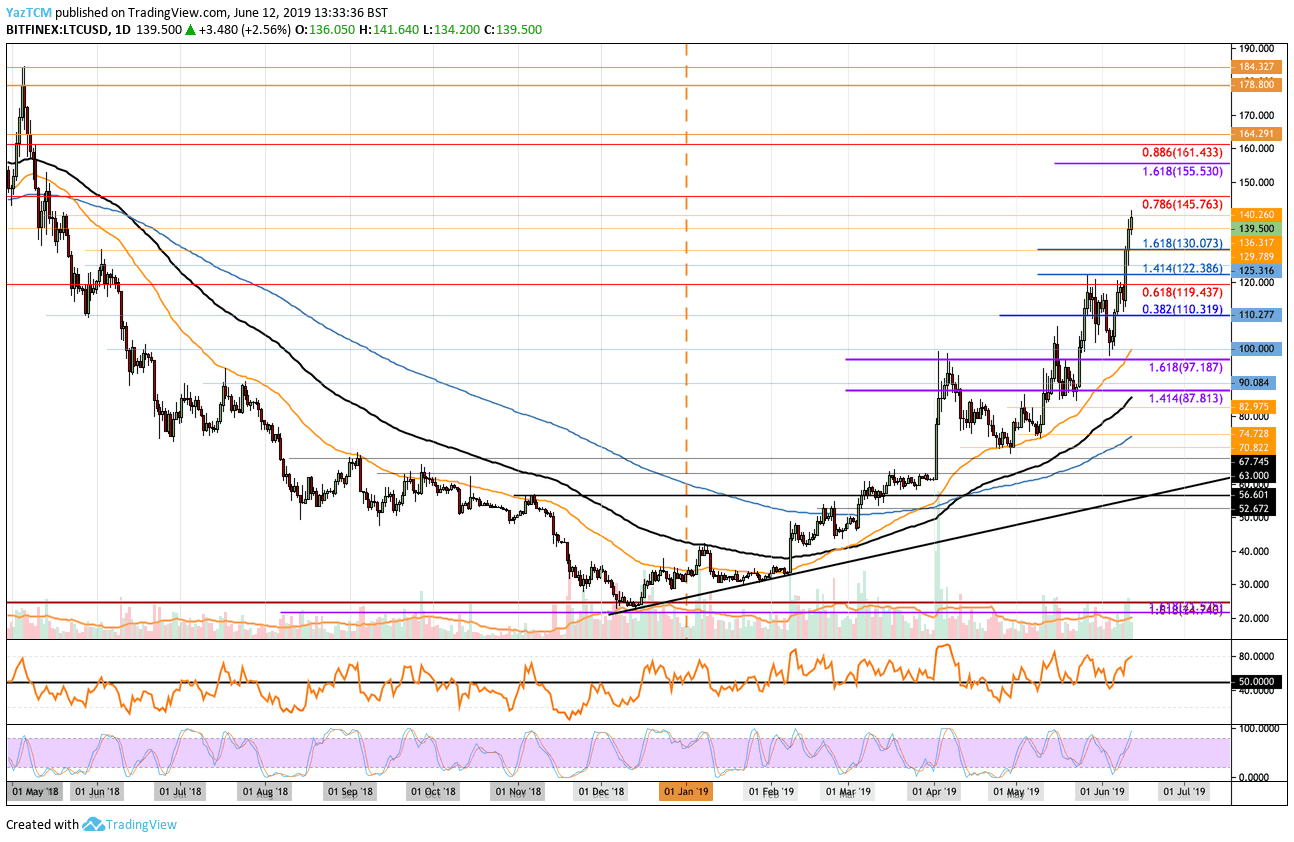
Looking at the LTC/USD 1-Day Chart:
- Since our previous Litecoin analysis, we can see that Litecoin has continued to surge above the resistance at the $119 level. Litecoin continued to appreciate, breaking the resistance at $122, $130, and $135 to reach the current level of resistance at $140.
- From above: the nearest level of resistance lies at $145 – which contains the bearish .786 Fib Retracement. If the bulls can continue to break above $150, we can expect higher resistance at $155 and $161 (where lies the bearish .886 Fib Retracement). Above $162, further higher resistance is located at $164, $170, $178 and $184 (which is the May 2018 high.
- From below: Initial support now lies at $136. Beneath this, further support lies at $130, $122 and $119. If the sellers continue beneath $119, further support lies at $110, $100 and $97.18.
- The Stochastic RSI has recently reached an area close to overbought conditions which hint that traders should be cautious as the market may be overstretched.
- The trading volume has been increasing aggressively during June 2019.
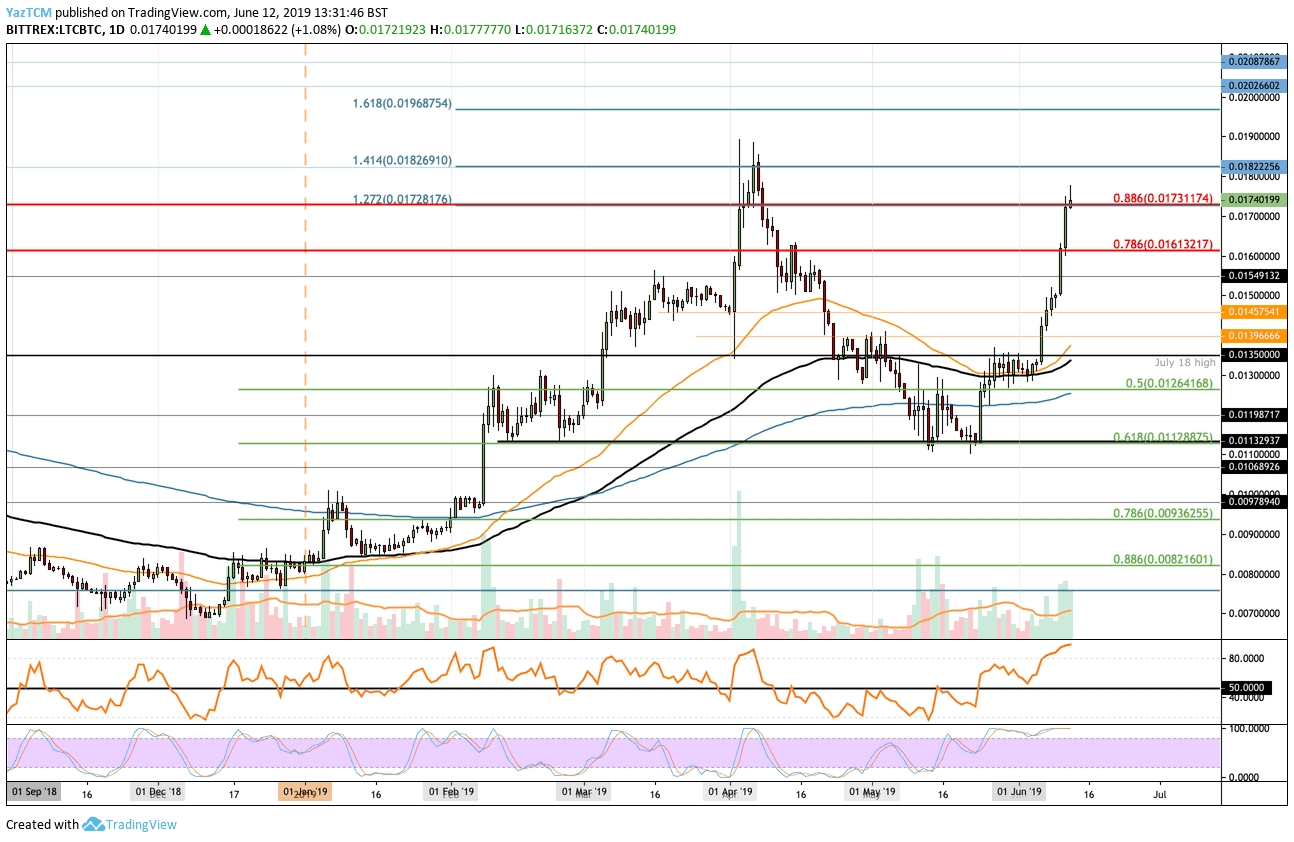
Looking at the LTC/BTC 1-Day Chart:
- Against Bitcoin, we can see that Litecoin has smashed through the previous resistance at 0.0145 BTC and has continued above 0.015 BTC to reach where it is currently trading at the 0.0173 BTC level.
- From above: The nearest level of resistance now lies at 0.018 BTC. Above this, further resistance is expected at 0.01826 BTC, 0.019 BTC, 0.01970 BTV, and 0.020 BTC.
- From below: The nearest level of support now lies at 0.0174 BTC. Beneath this, the support is located at 0.017 BTC, 0.016 BTC, 0.01550 BTC, and 0.015 BTC.
- Both the Stochastic RSI and the RSI itself have reached extreme overbought conditions which shows that the market is very stretched.
- The trading volume has also seen a significant increase during June 2019 as price increases aggressively.
The post Litecoin Price Analysis: LTC Surges Ahead of Halving – Can It Break-Up $140? appeared first on CryptoPotato.

