Litecoin Price Analysis: LTC Struggles To Maintain The 0.01 BTC Critical Level
Litecoin saw a very static 30 day trading period as it only increased by 3% to get to its current levels around $120. The coin started to show some signs of weakness this month as LTC dropped heavily against BTC. However, LTCUSD is still following a rising trend line which currently puts it on the bullish side.
Litecoin remains the 4th largest cryptocurrency with a market cap of $7.52 billion. Litecoin is also scheduled to undergo a block halving next month as we anticipate LTC rising against BTC in the run-up toward the halvening.
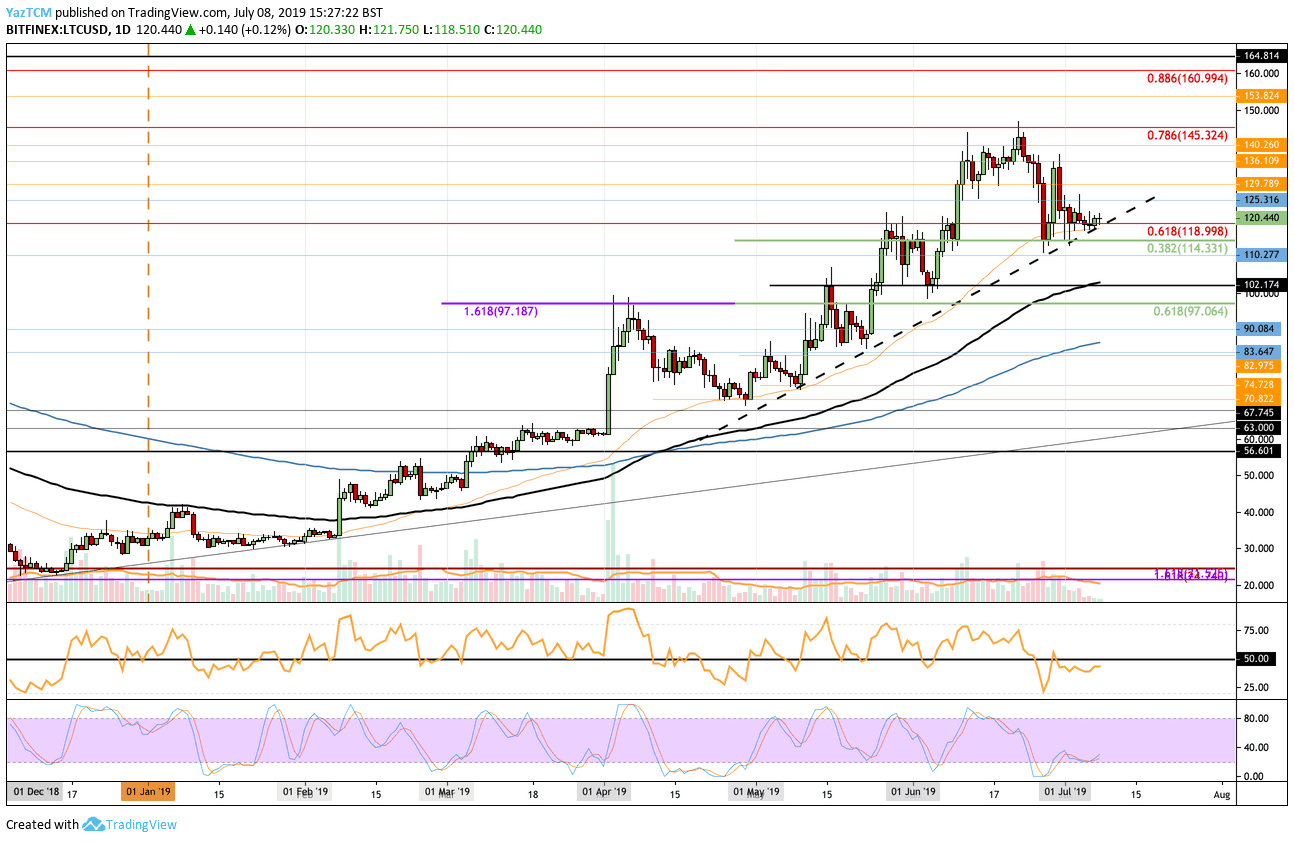
Looking at the LTC/USD 1-Day Chart:
- Since our previous Litecoin analysis, Litecoin managed to hold at the support around $114 which is provided by a short term .382 Fib Retracement level. Litecoin is now trading above $120 and has been trading above a rising trend line which is still intact.
- From above: The nearest level of resistance lies at $125 and $130. Above this, higher resistance is then located at $136 and $140. If the sellers continue above $140, significant resistance is found at $145 which contains the long term bearish .786 Fibonacci Retracement level. This resistance had caused problems for LTC during June and it caused the coin to roll over.
- From below: The nearest levels of support lie at $120 and the rising trend line. If the sellers push the market beneath the rising trend line, support toward the downside lies at $114, $110, $102, and $100 (which also contains the 100 days EMA). Below $100, further support is found at $97.06, $95, and $90.
- The trading volume has been falling heavily during July which could be a sign that the sellers are finished selling.
- The Stochastic RSI has recently produced a bullish crossover signal in oversold territory which is a strong sign for the bulls. However, we will need to see the RSI break above 50 to indicate that the bulls are in control of the market momentum.
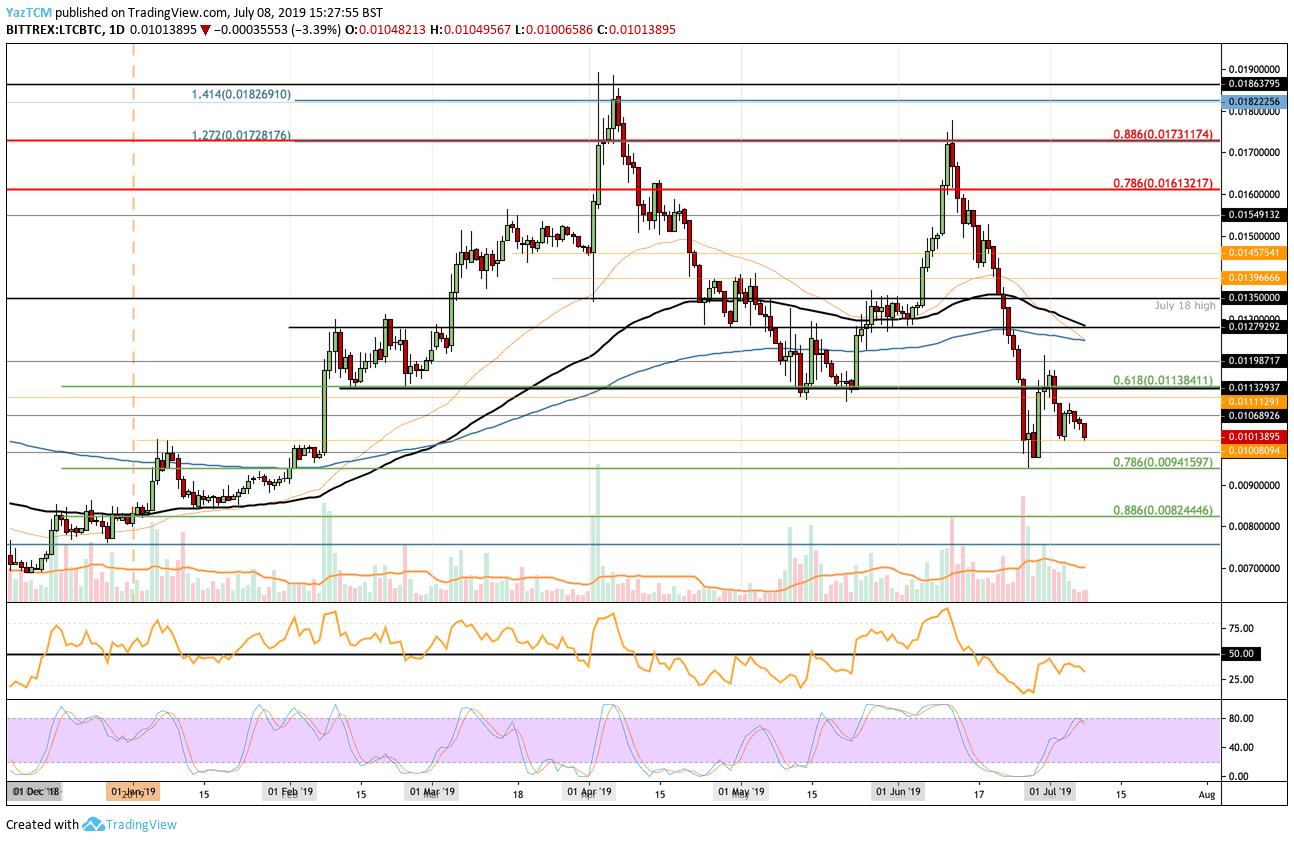
Looking at the LTC/BTC 1-Day Chart:
- Against Bitcoin, we can see that LTC struggled to break above the 0.01150 BTC resistance level during July and has consequentially fallen lower into support around 0.0101 BTC.
- From above: The nearest levels of resistance lie at 0.010689 BTC, 0.01111 BTC, and 0.01138 BTC. Above this, higher resistance is found at 0.0012 BTC, 0.0127 BTC (which contains the 100 days EMA), 0.013 BTC, and 0.0135 BTC.
- From below: The nearest level of support now lies at 0.0101 BTC. Beneath this, further support toward the downside is found at 0.01 BTC and then at 0.009415 BTC (which contains the .786 Fib Retracement). If the selling continues beneath 0.009415 BTC the next level of support below lies at 0.009 BTC and 0.0082.
- The Stochastic RSI has produced a bearish crossover signal in overbought territory which is a bad sign for LTC. Furthermore, the RSI remains well below the 50 level to indicate that the sellers are in control of the market momentum.
The post Litecoin Price Analysis: LTC Struggles To Maintain The 0.01 BTC Critical Level appeared first on CryptoPotato.