Litecoin Price Analysis: LTC Struggles Heavily Against Rising Bitcoin and Drops To 5th Place Below Bitcoin Cash
Litecoin has been struggling slightly after recently dropping by 1.29% over the past 24 hours, bringing the current price down to $132.68. The coin met resistance a few days ago at the $145 level and started to fall. The latest price drop can largely be attributed to Litecoin falling aggressively against Bitcoin.
Litecoin currently sits on a market cap of around $8.24 billion market cap. It has been unseated by Bitcoin Cash which took the place of the fourth largest cryptocurrency. Despite the recent price stagnation, LTC is still up 117% over the past 3 months as traders started to build their positions ahead of the block halvening that’s scheduled for early August 2019.
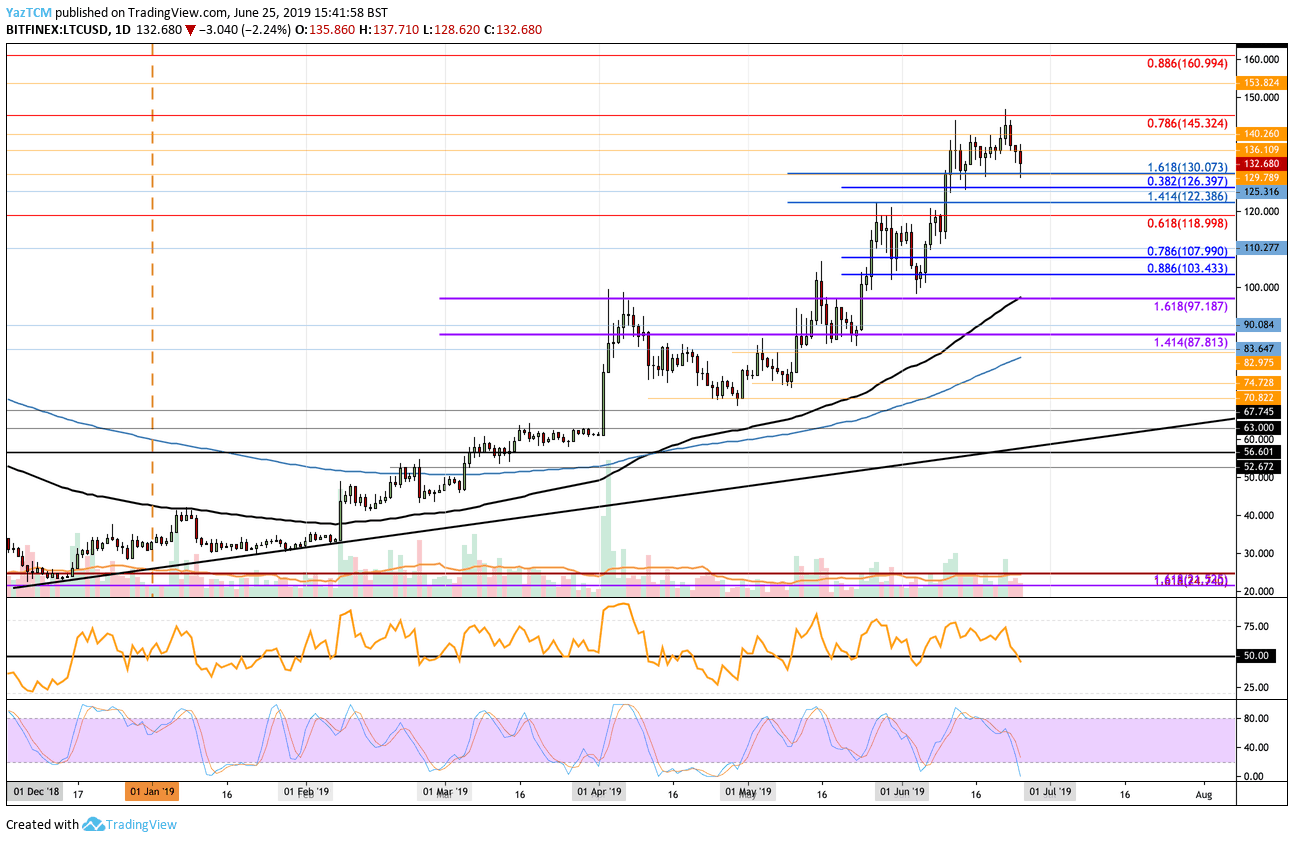
Looking at the LTC/USD 1-Day Chart:
- Since our previous Litecoin analysis, we can see that LTC went on to climb higher into our expected resistance at $145.32. However, the market rolled over and fell from there. Litecoin found support at $130 which had allowed it to bounce toward $132.
- From above: The nearest level of resistance now lies at $136 and $140. Above $140, the next level of resistance is at $145.32 (bearish .786 Fib Retracement) and then at $150. If the buyers continue above $150, further resistance is found at $153.82 and $160.99 (.886 Fib Retracement).
- From below: The nearest level of support lies at $130. Beneath this, further support stands at $126.40, $122.40, and $120. If the sellers push LTC beneath $120, support can be expected at $118.99, $107.99, $103.50, and $100.
- The trading volume has remained high and above average over the past few days.
- The Stochastic RSI has recently slipped into overbought conditions which suggest that the selling may be coming to an end over the next few days as we wait for a bullish crossover signal above.

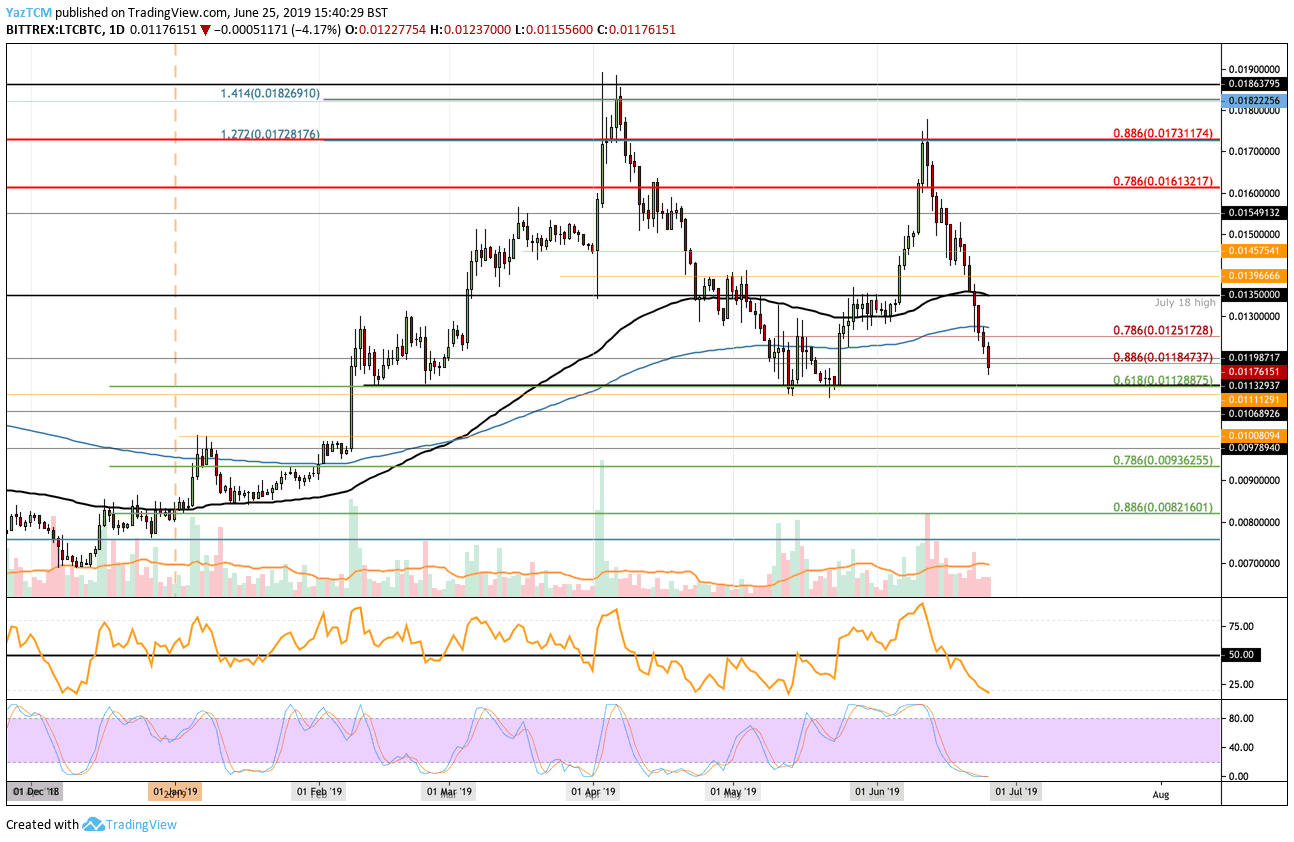
Looking at the LTC/BTC 1-Day Chart:
- Against Bitcoin, we can see that LTC has been struggling heavily causing damage to the LTC/USD market. LTC has been falling against BTC since reaching resistance in early June at 0.01731 BTC. The coin went on to drop beneath both the 100 days EMA and the 200 days EMA to where it currently trades at 0.01175 BTC.
- From above: The nearest level of resistance lies at 0.012 BTC, 0.0125 BTC (200 days EMA), and 0.0135 BTC (July 2018 high). If the bulls continue above 0.0135 BTC, higher resistance stands at 0.014 BTC, 0.0145 BTC, 0.015 BTC, and 0.01610 BTC.
- From below: The nearest level of support now lies at 0.01128 BTC. This support is deemed to be strong as it had provided strong support for the market during May 2019 and also contains a long term .618 Fib Retracement. Beneath this, further support can be found at 0.0111 BTC, 0.0106 BTC, 0.01 BTC, and 0.0093 BTC.
- The trading volume has remained high but below the recent average.
- Both the Stochastic RSI and the RSI itself suggest that the selling may be coming to a close as they approach oversold trading conditions. If the Stochastic RSI can produce a bullish crossover signal near the 0.0112 BTC support, we may see a rebound in LTCBTC.

The post Litecoin Price Analysis: LTC Struggles Heavily Against Rising Bitcoin and Drops To 5th Place Below Bitcoin Cash appeared first on CryptoPotato.


