Litecoin Price Analysis: LTC Fell Below $50, is $40 Next?
Litecoin saw a sharp price decline of around 12% over the past 24 hours and it currently trades at $46.34. LTC is now down by a total of 21% over the past week which is largely a result of Bitcoin dropping by 10% in a day.
LTC remains the sixth-largest cryptocurrency with a market cap of $2.96 billion.
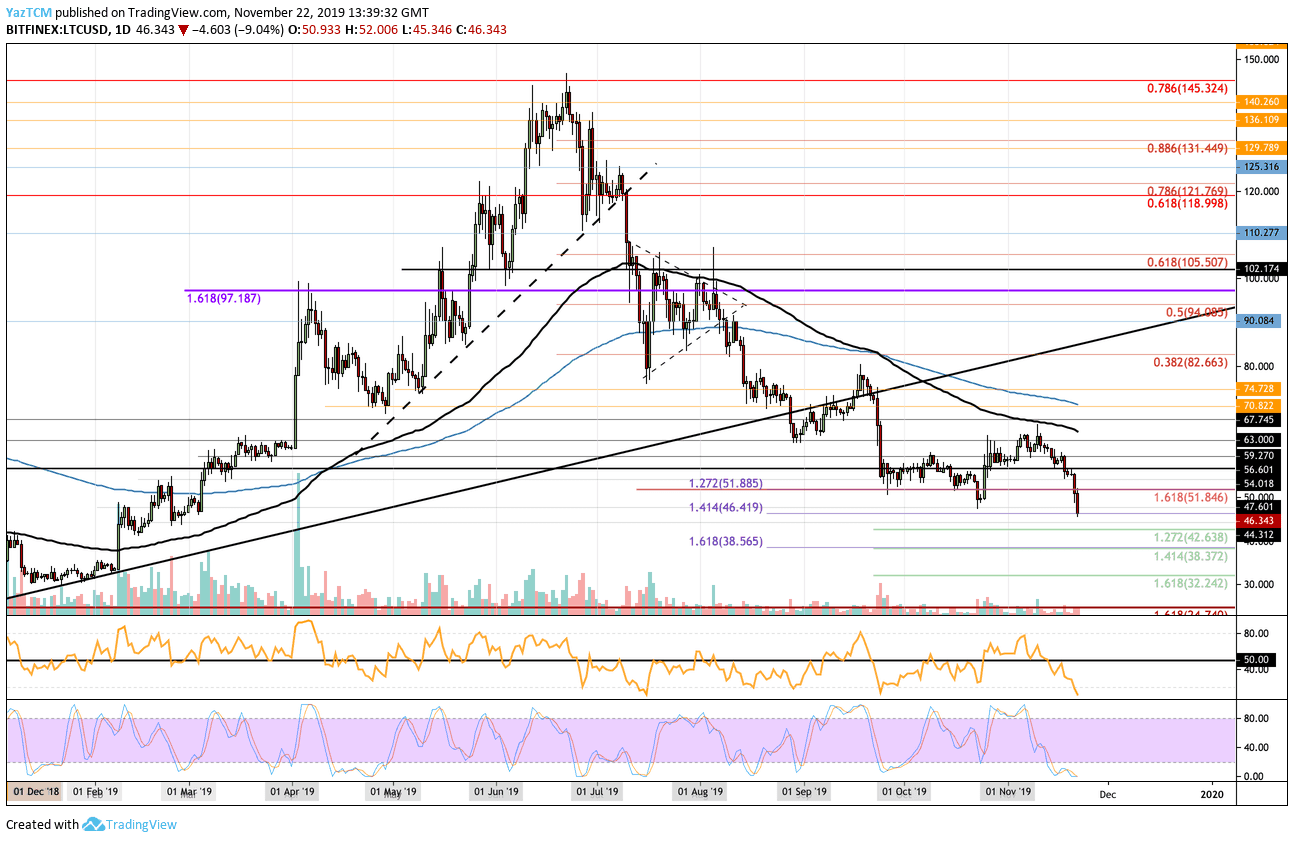
Looking at the LTC/USD 1-Day Chart:
- LTC has plummetted pretty aggressively over the past 24 hours as it dropped below the support at $50 to reach the current support at $46.41. Litecoin has been on a bearish trend since late June as the cryptocurrency made fresh 9-month lows.
- From above: The nearest level of resistance lies at $50. Above this, resistance is located at $54 and $60. Higher resistance is expected at $64 (100-days EMA) and $70.80 (200-days EMA).
- From below: The nearest level of support lies at $44.31. Beneath this, support is found at $40 and $38.56 (downside 1.618 Fib Extension). The final level of support to highlight is located at $32.24.
- The trading volume remains pretty low, beneath the average for the year.
- The Stochastic RSI is in oversold conditions as we wait for a bullish crossover signal to send the market higher. For a sign that the selling pressure is fading, we will look for the RSI to start to climb higher toward the 50 level.
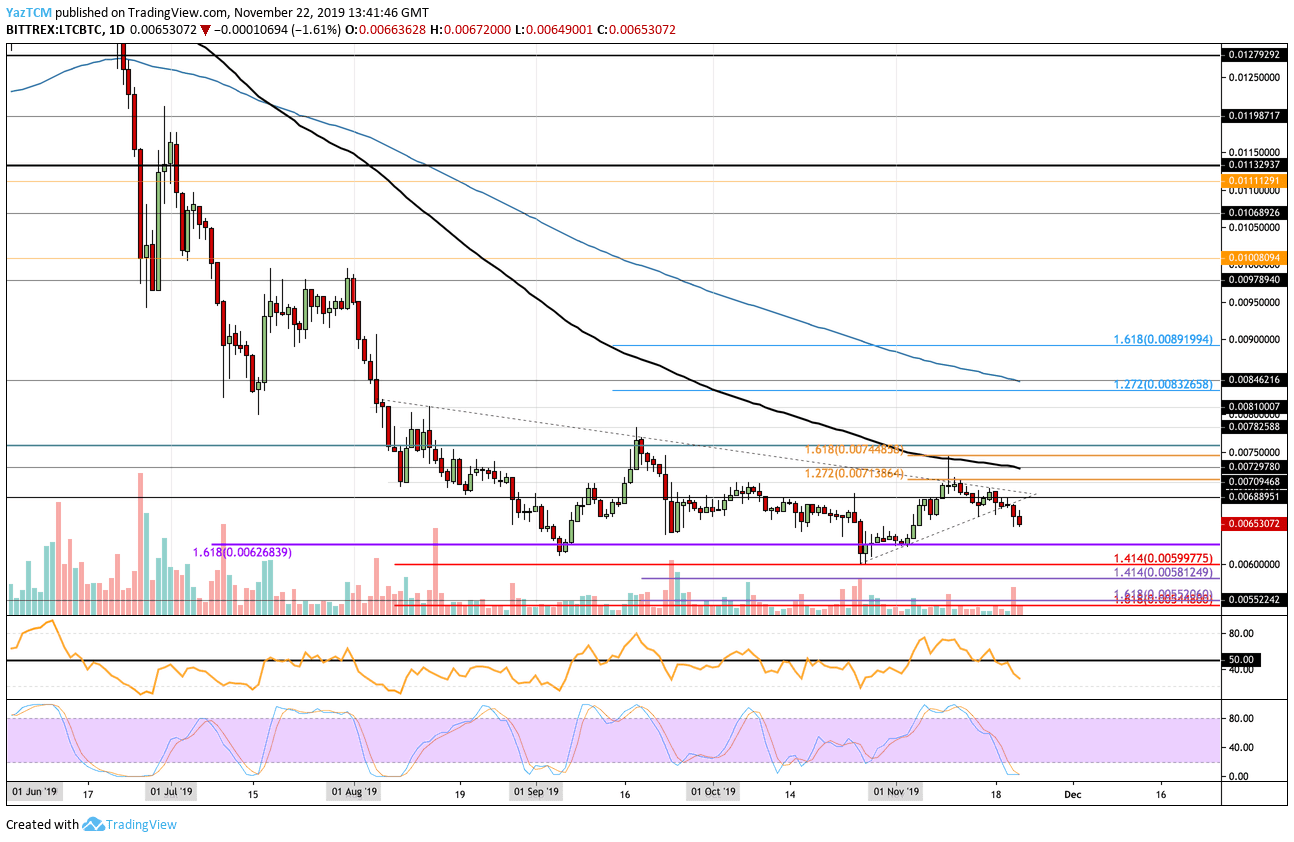
Looking at the LTC/BTC 1-Day Chart:
- Against Bitcoin, LTC fell lower as it breaks beneath a short term triangle. Litecoin currently trades at 0.006BTC as the bulls battle to prevent it from heading further lower.
- From above: The nearest level of resistance lies at 0.0068BTC. Higher resistance is expected at 0.0071 BTC, 0.007297 BTC (100-days EMA).
- From below: The nearest level of support lies at 0.0064 BTC. Beneath this, support is located at 0.0062 BTC and then at 0.005812 BTC.
- The trading volume has increased during the latest round of selling.
- The Stochastic RSI is poised for a bullish crossover that could begin the rebound for the cryptocurrency.
The post Litecoin Price Analysis: LTC Fell Below $50, is $40 Next? appeared first on CryptoPotato.


