LINK Conquered $10 Moments Before Bitcoin’s Rally: Chainlink Price Analysis
- Chainlink saw an impressive 32% surge over the past week as the coin edges toward $10.
- The resistance at $10 is expected to be very strong and will require some significant volume to overcome.
- Against Bitcoin, LINK is struggling to break 90,000 SAT.
LINK/USD: LINK Bulls Spike Toward $10 Before Falling To $9.40
Key Support Levels: $9, $8.58, $8.00.
Key Resistance Levels: $10, $10.50, $11.
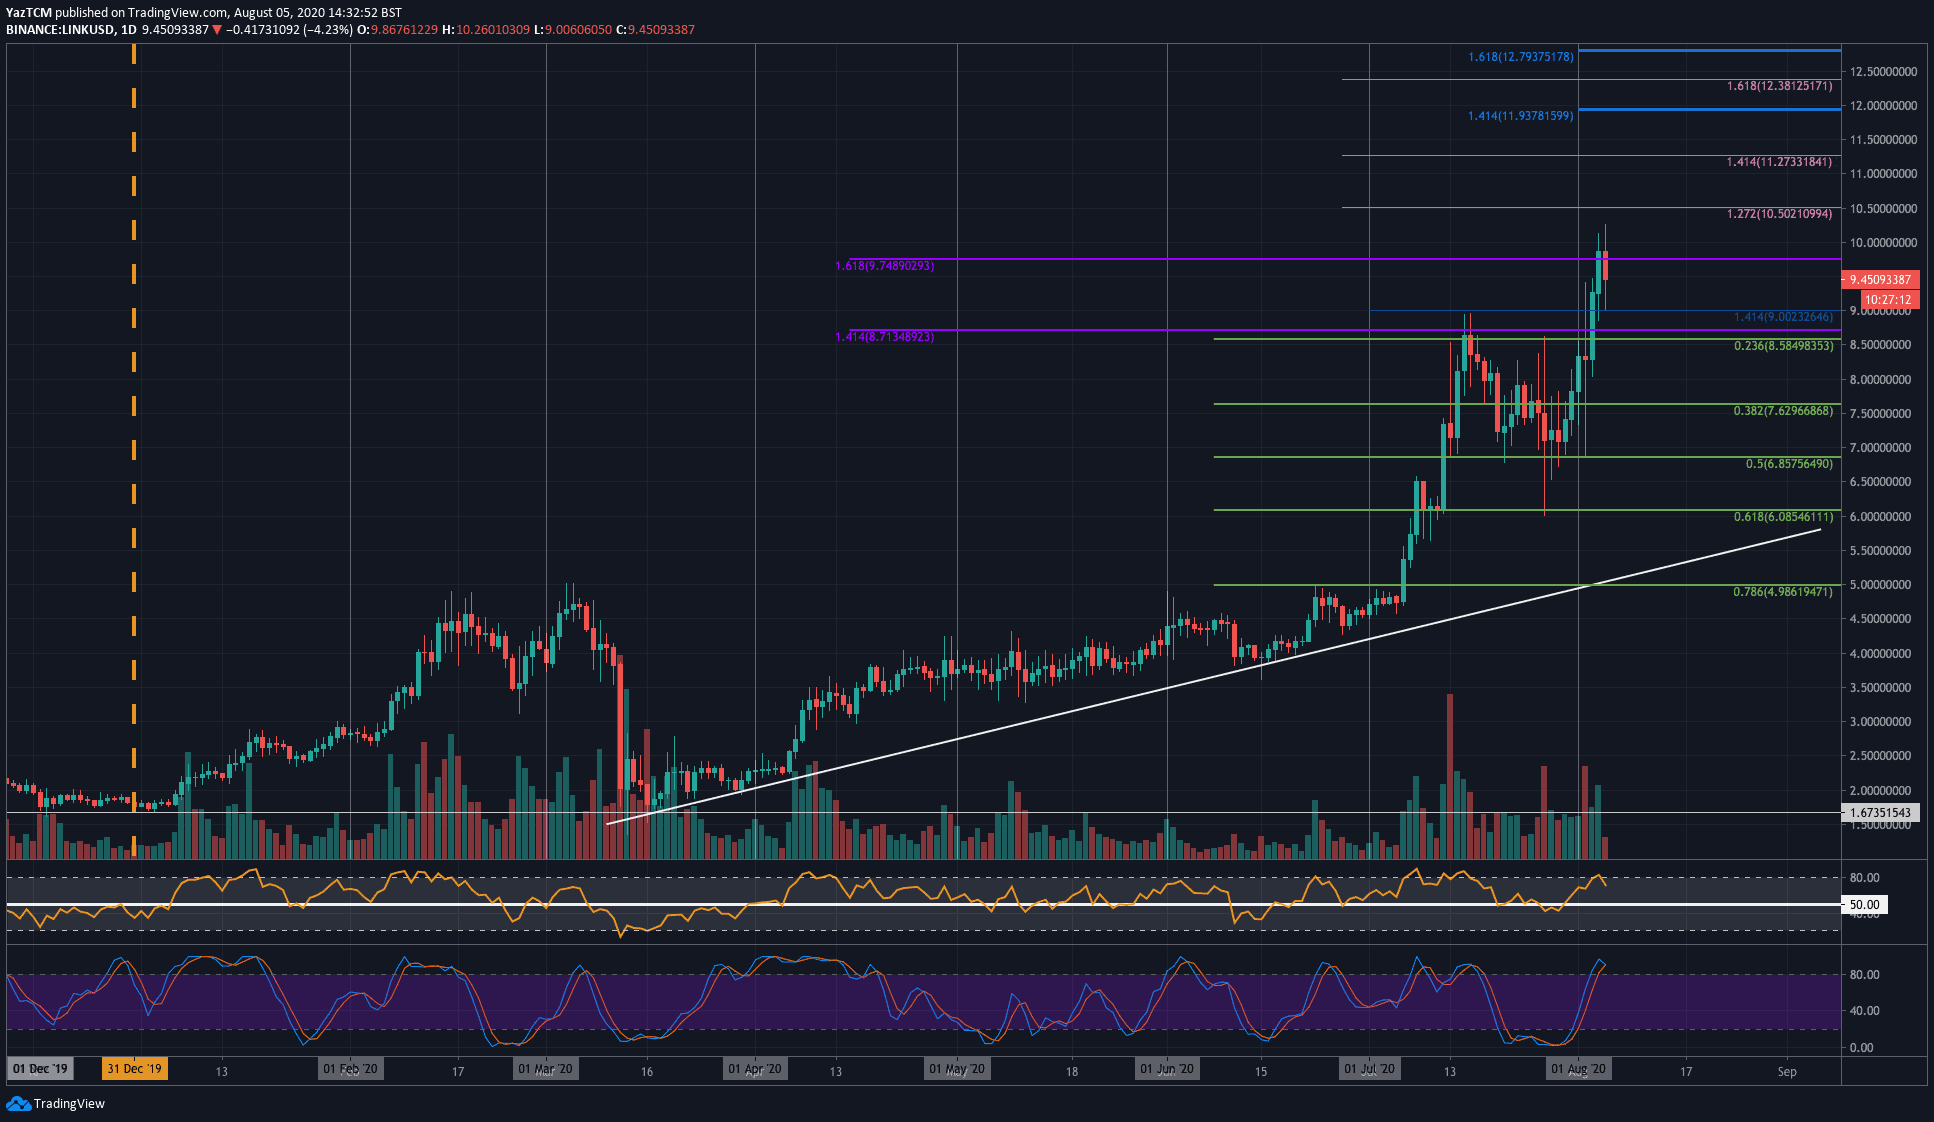
Chainlink saw a massive price increase in July 2020 as the coin reached as high as $8.71 toward the middle of the month. From there, it went on to drop until support was found at $7.00, which allowed LINK to rebound higher at the end of the month.
In August, LINK continued to push upwards as it broke above the previous resistance at $8.71 and managed to spike as high as $10.00 moments before Bitcoin lifted its head. The coin has since dropped to $9.45 after finding reliable support at $9.00.

LINK-USD Short Term Price Prediction
Looking ahead, if the buyers regroup and push higher, the first level of resistance lies at $10. Above this, resistance is located at $10.50 (1.272 Fib Extension), $11, and $11.27 (1.414 Fib Extension).
On the other side, the first level of strong support lies at $9.00. Beneath this, support lies at $8.58 (.236 Fib Retracement), $8.00, and $7.62 (.382 Fib Retracement).
The RSI has dropped lower from overbought conditions today as the bulls start to reach exhaustion. So long as LINK remains above 50, it will keep in its bullish trend. Additionally, the Stochastic RSI produced a bearish crossover signal, which is a negative sign.
LINK/BTC: Bulls Turned Away From 90,000 SAT Resistance
Key Support Levels: 75,000 SAT, 70,000 SAT, 62,000 SAT.
Key Resistance Levels: 90,000 SAT, 95,000 SAT, 100,000 SAT.
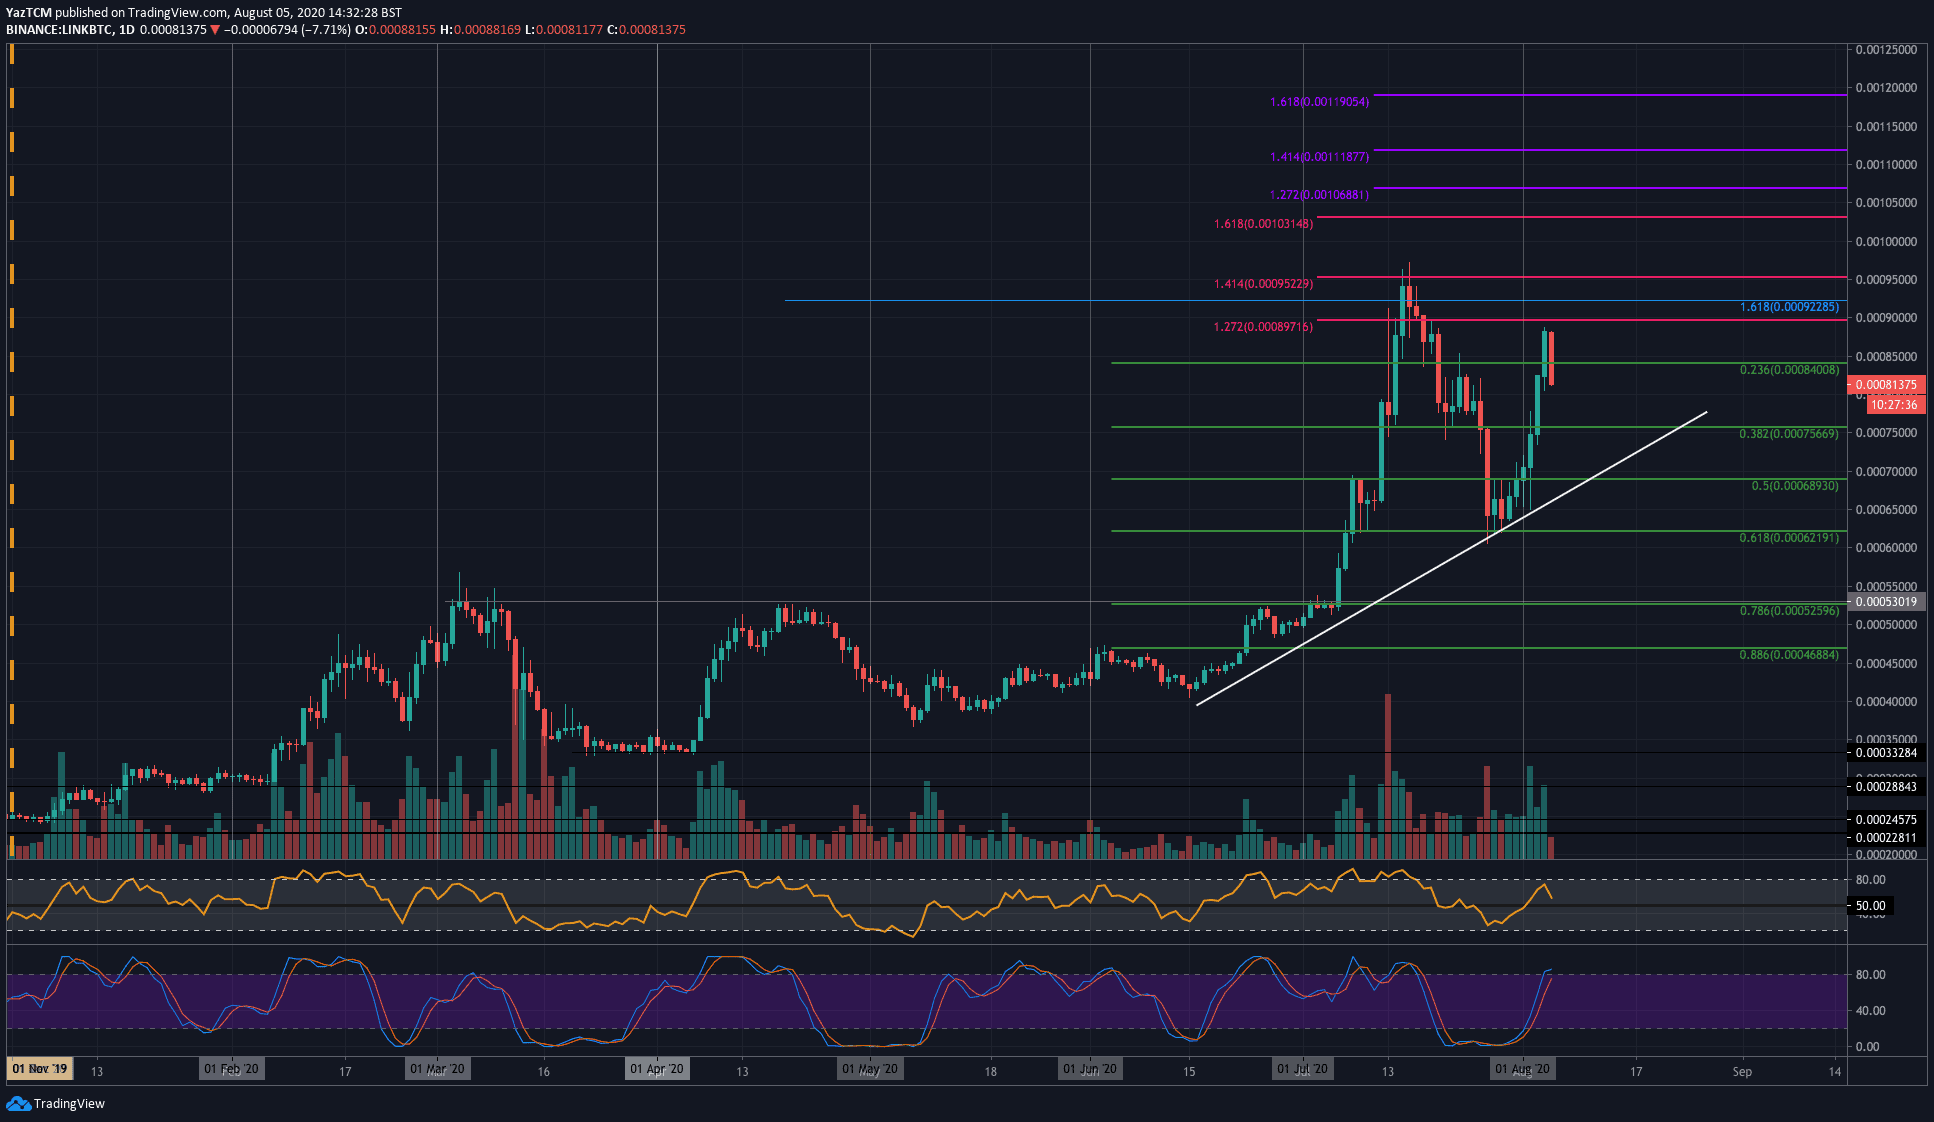
Against Bitcoin, LINK also performed remarkably well in July as it surged as high as 95,000 SAT (1.414 Fib Extension) by mid-July. From there, it fell lower until support was found at 62,000 SAT (.618 Fib Retracement). This support was further bolstered by a rising trend line, which allowed LINK to rebound.
LINK has surged during August as it reached the 90,000 SAT level today. Unfortunately, it was unable to break this level as it dropped lower to where it’s currently trading at 81,000 SAT.

LINK-BTC Short Term Price Prediction
Looking ahead, if the sellers push LINK lower, the first level of support lies at 75,000 SAT (.382 Fib Retracement). This is followed by support at 70,000 SAT (.5 Fib Retracement & rising trend line support) and 62,000 SAT (.618 Fib Retracement).
On the other side, the first level of resistance lies at 90,000 SAT. Above this, resistance is expected at 95,000 SAT (1.414 Fib Extension), 100,000 SAT, and 103,000 SAT (1.618 Fib Extension).
Likewise, the RSI dropped lower from overbought conditions but still remains above the 50 line as the bulls remain in control. However, the Stochastic RSI is primed for a bearish crossover signal that could see LINK returning to the rising support line.
The post LINK Conquered $10 Moments Before Bitcoin’s Rally: Chainlink Price Analysis appeared first on CryptoPotato.


