Last Time This Indicator Flashed, Bitcoin Spiked Almost 100%
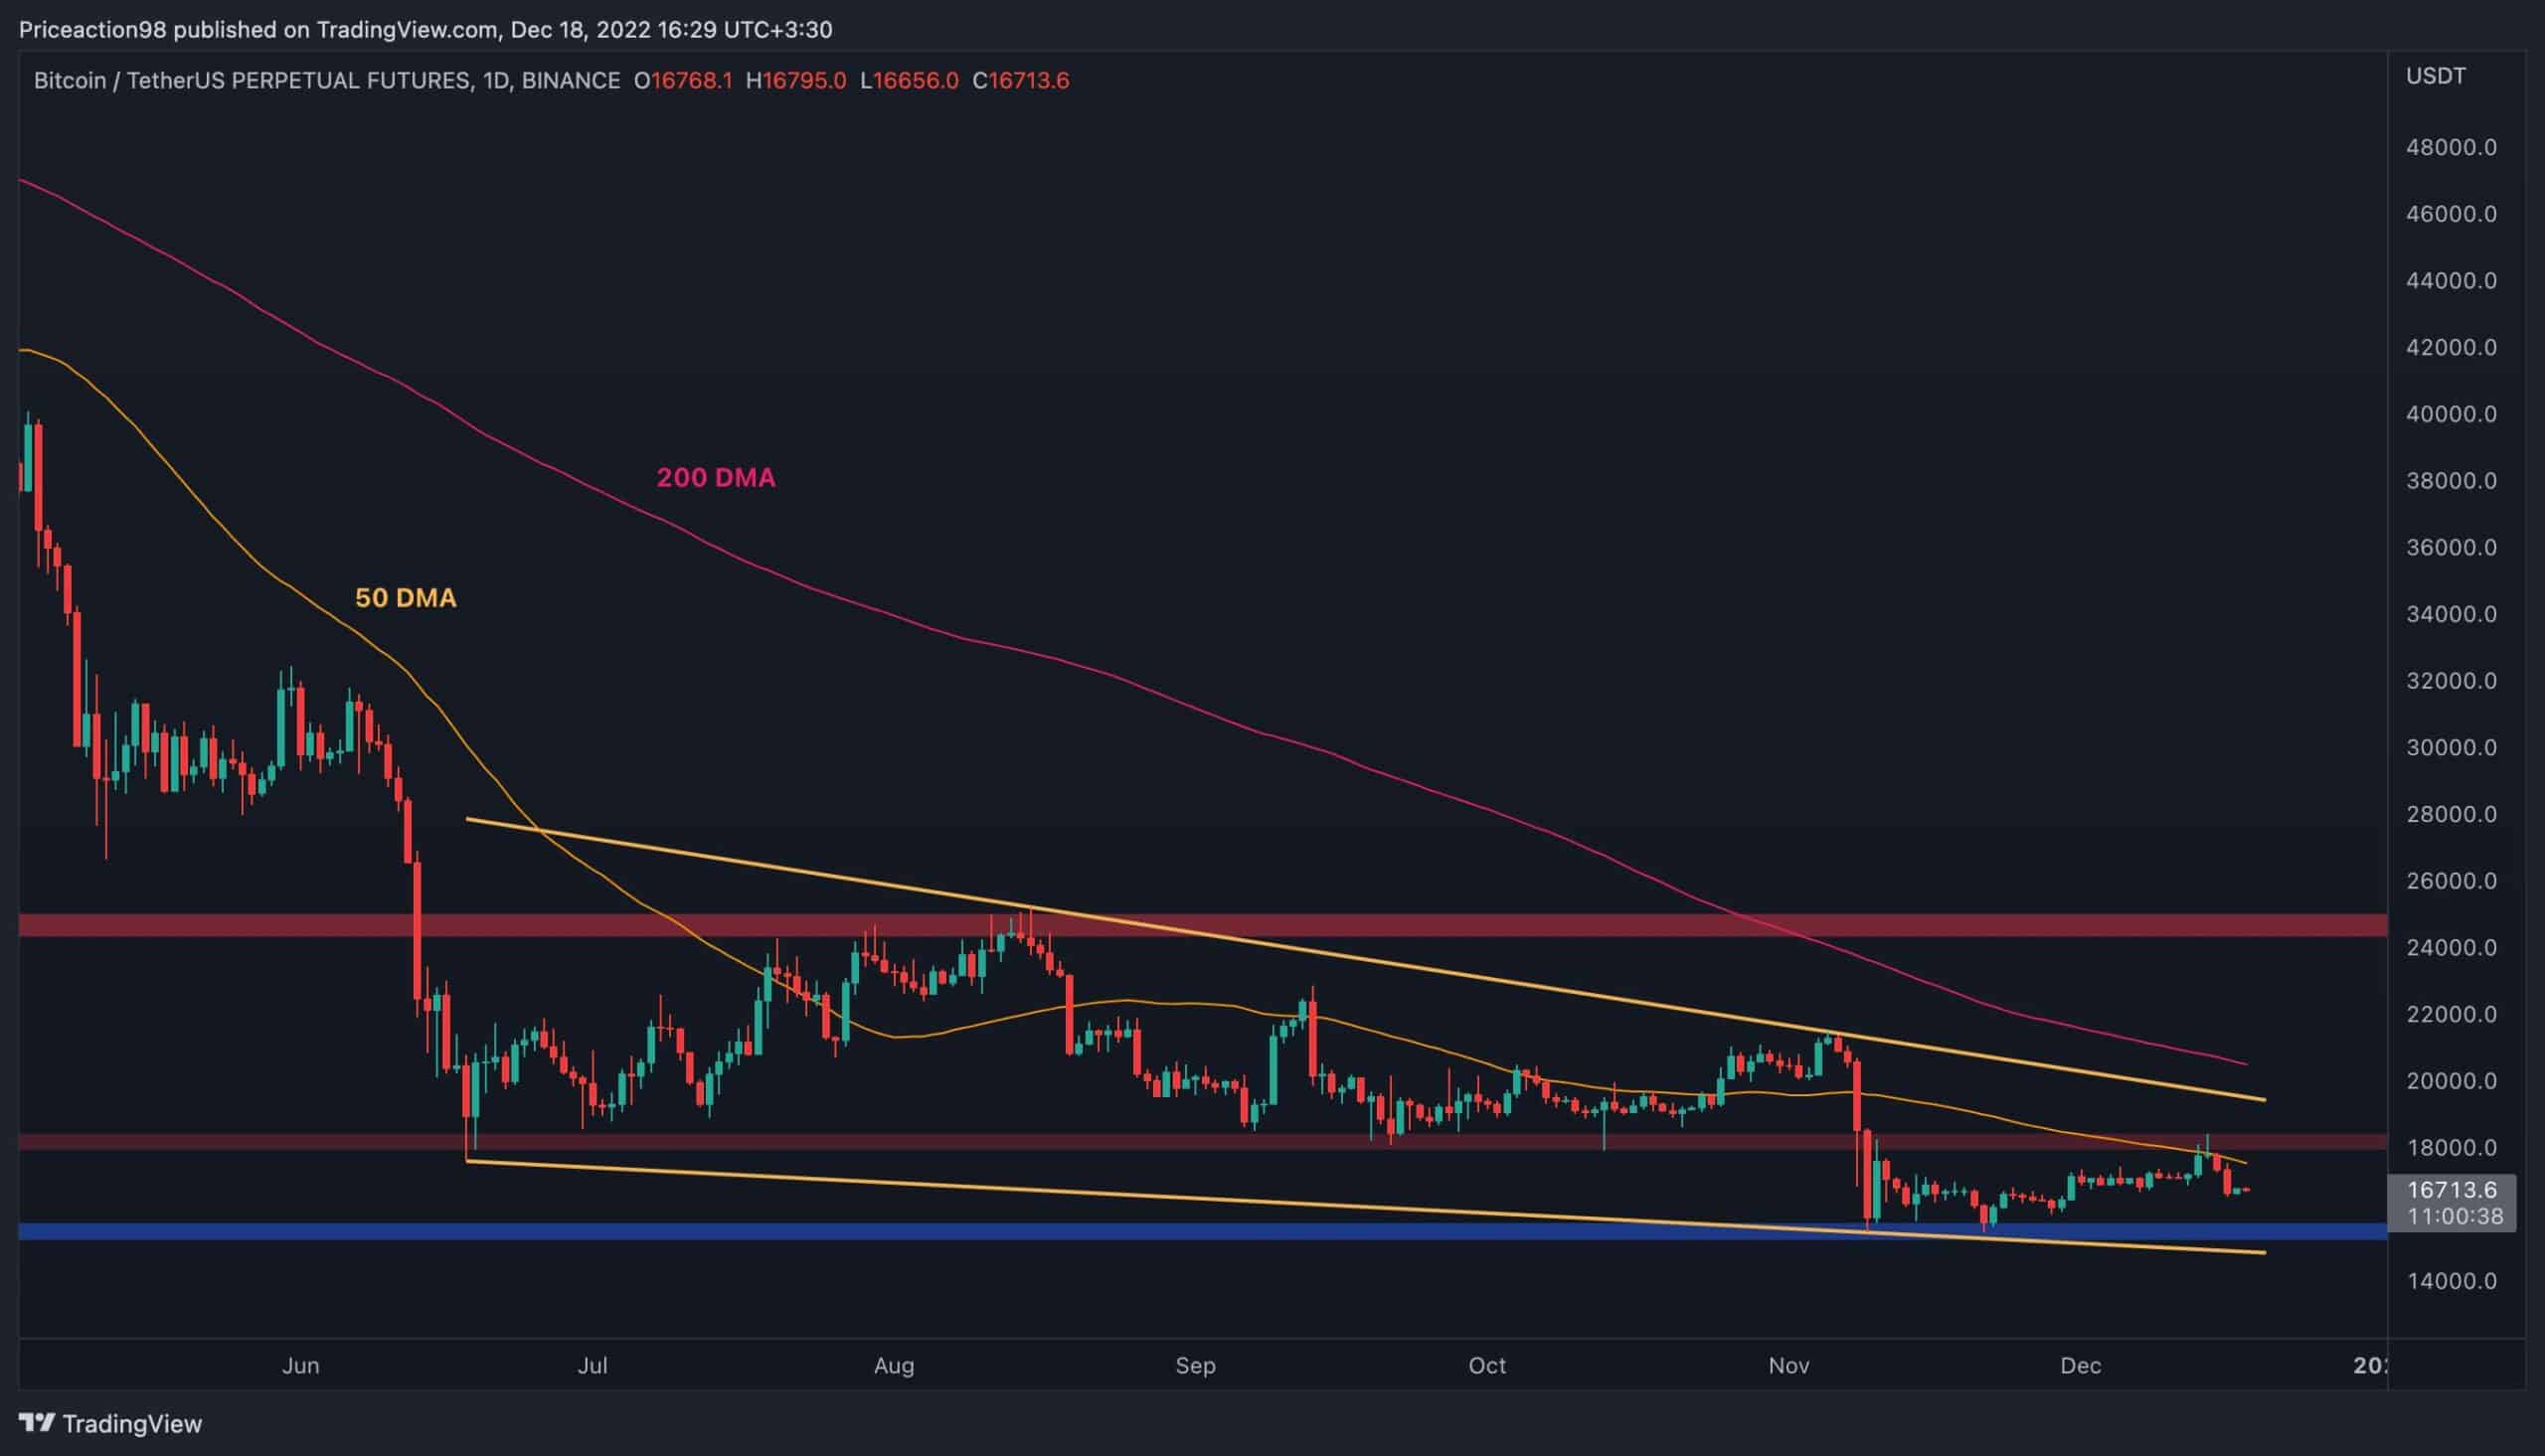
Traders are once again hoping for a bullish run as a fresh slash of green spread across the entire crypto market. Interestingly, the 50-DMA indicator shows that the cryptocurrency might be in a good shape for further gains.
- Bitcoin surged to $45,500 today for the first time since January 5th as the cryptocurrency market managed to reclaim the $2 trillion mark.
- Although BTC failed to sustain the $45,000 levels and is currently trading slightly below the $44,000 region, the leading cryptocurrency flashed an indicator that was last seen before a massive rally last year.
- Yesterday, BTC closed above the 100-day period displaced moving average (DMA), an indicator that things are looking good again for the asset.
- A displaced moving average (DMA) is a type of moving average (MA) indicator that helps to determine trend directions. If the price closes above the MA, it is above average, which could be a sign of an uptrend. However, when the price closes below the MA, it indicates a downtrend.
- The last time bitcoin closed above the 100-DMA was in July, just before bitcoin surged by almost 100% from around the $35,000 region.
- Commenting on the matter was a popular crypto analyst.
last time we got a nice close above the 100 dma was back in july which was the start of an almost 100% rally, so things are defo starting to look good again imo.#btc pic.twitter.com/q4ZNKgFRKq
— Bluntz (@SmartContracter) February 8, 2022
- Vijay Ayyar, head of Asia-Pacific at Luno Pte, believes the next stop for the leading cryptocurrency is $46,000 to $47,000.
“Bitcoin has broken some key levels and a downward-trending line here over the past few days and is showing signs of bullishness. it’s being capped by the 50-DMA and needs to close above it. The next stop from here is $46,000 to $47,000,” Ayyar said.