Is XRP Preparing Another Rally to $0.60? (Ripple Price Analysis)
Ripple’s price has gradually increased, drawing closer to the 100-day moving average depicted on the daily chart.
Should it successfully surmount the significant resistance posed by the 100-day moving average, the likelihood of transitioning to a bullish market becomes increasingly probable.
Technical Analysis
By Shayan
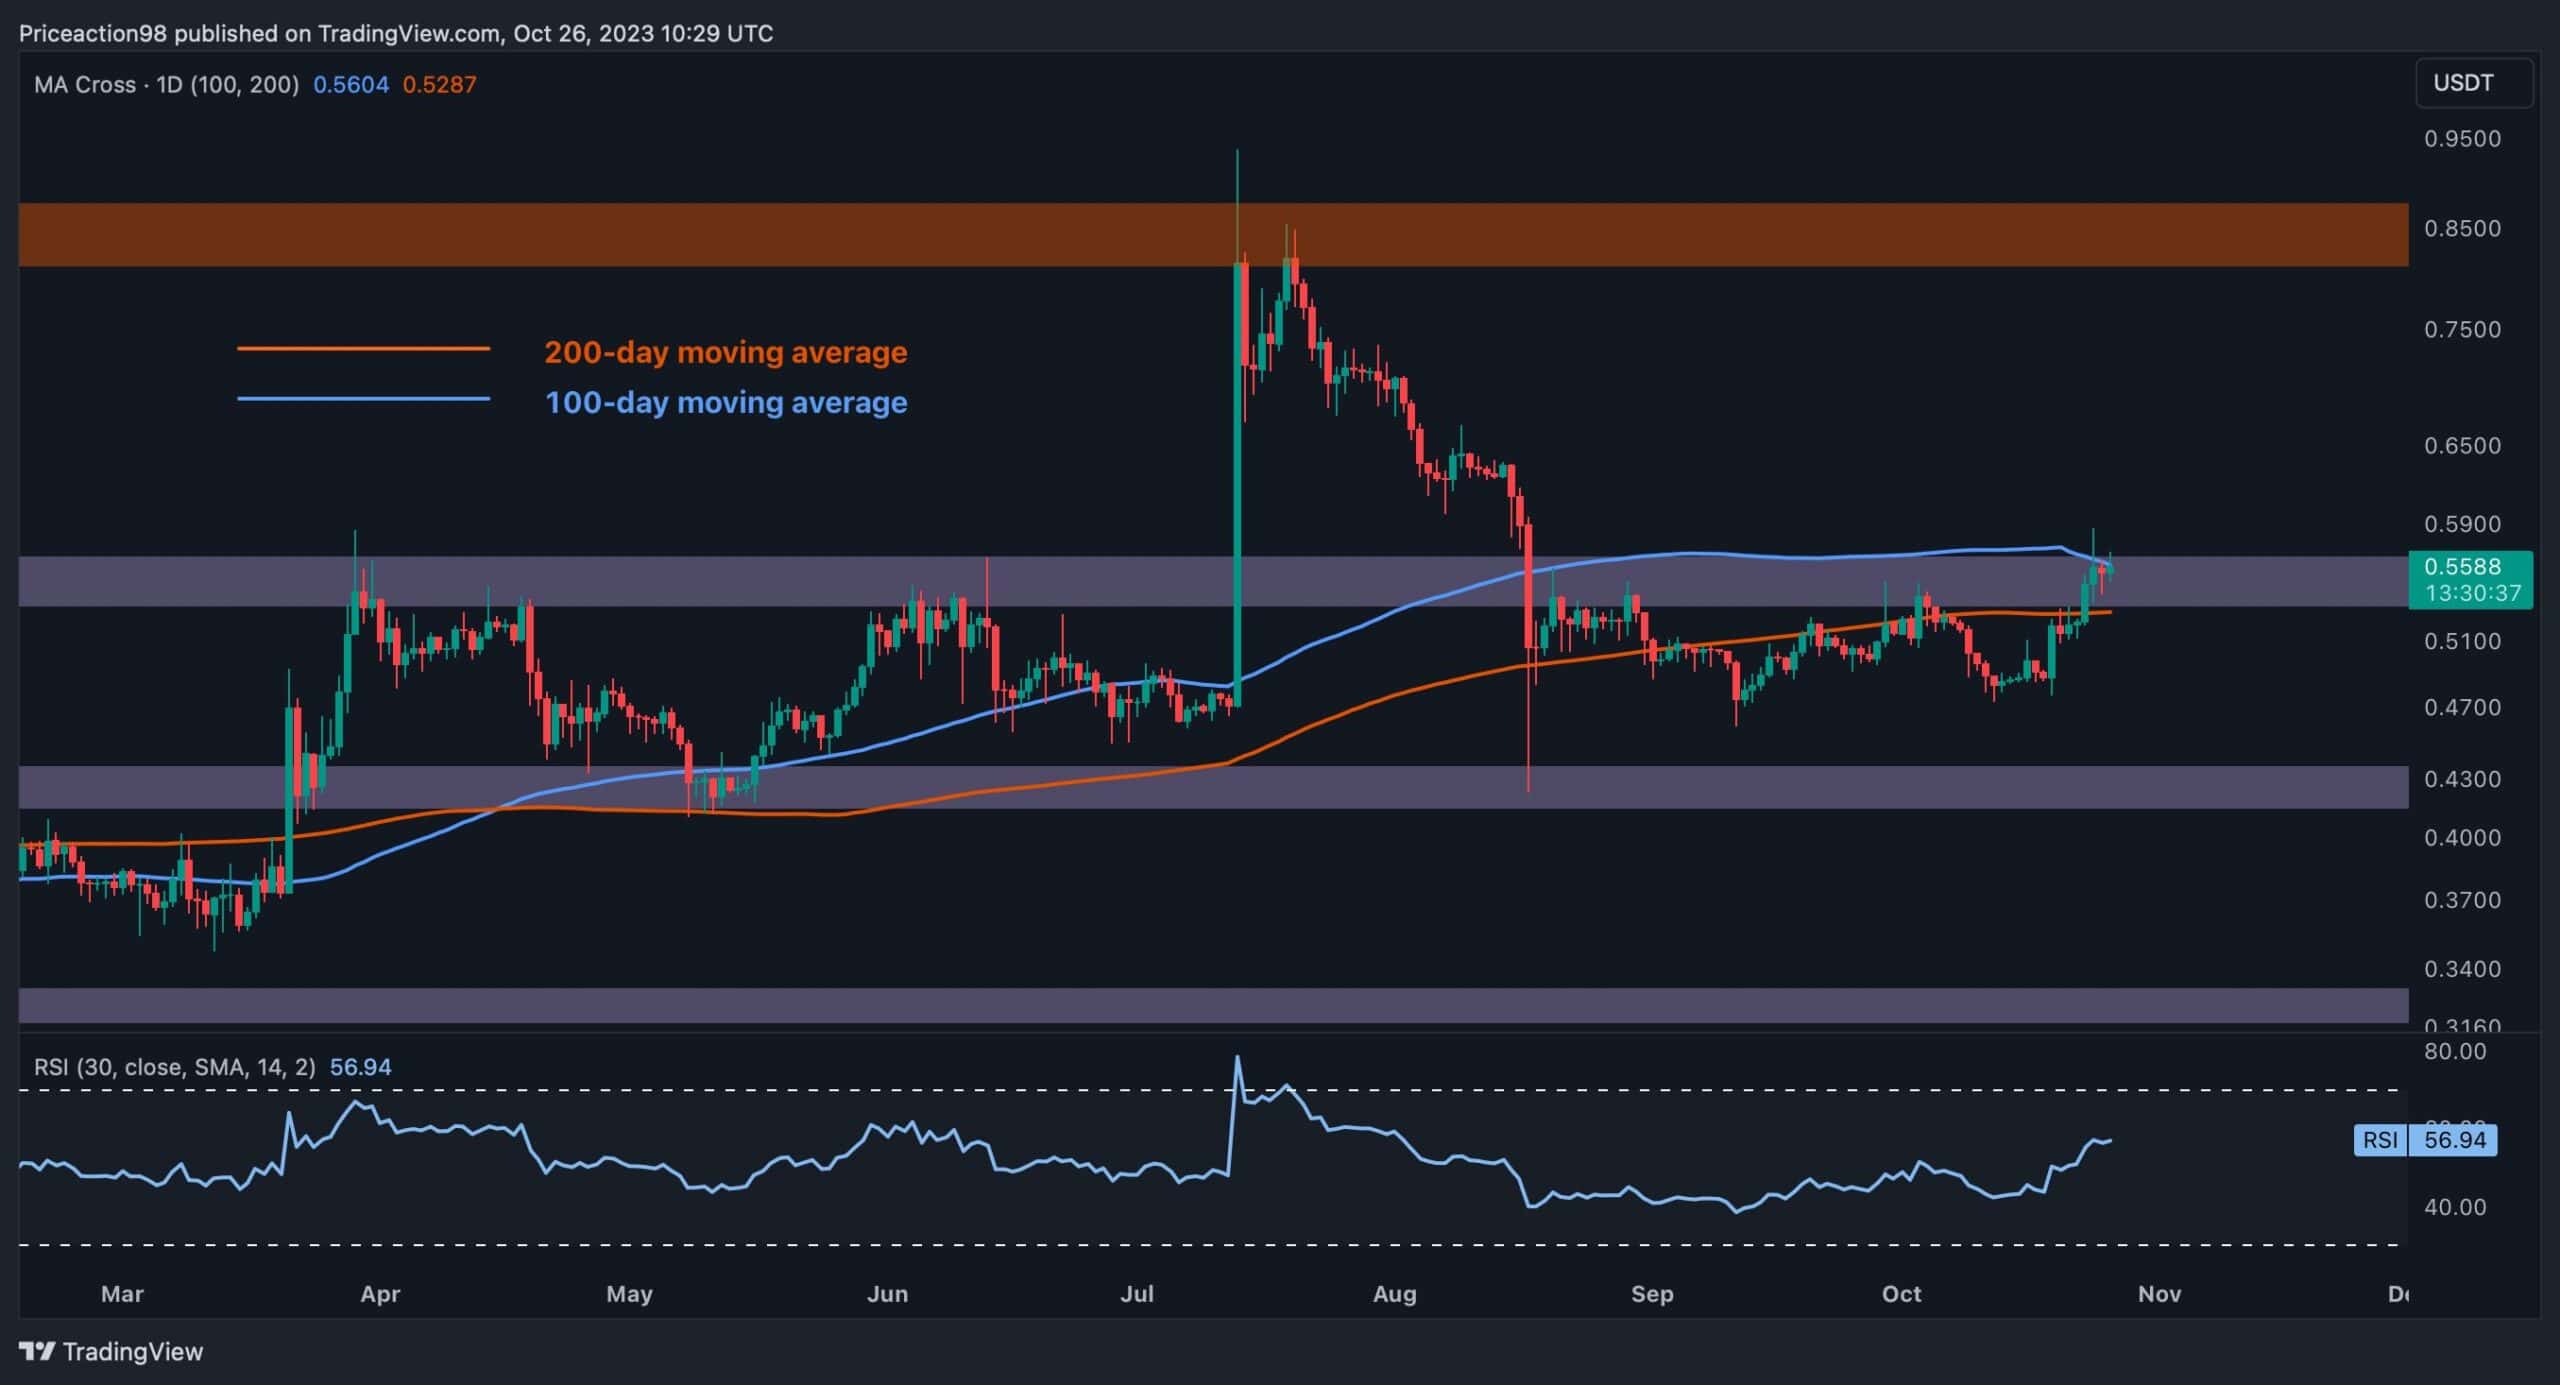
The Daily Chart:
A review of the daily chart reveals that Ripple’s price underwent a sideways consolidation phase, followed by a promising uptrend that retraced back to the 200-day moving average at $0.528, effectively recapturing this critical level.
The pivotal role of the 200-day moving average as a robust resistance level cannot be emphasized enough. Breaking through it signifies the potential for a bullish market shift, indicating the prospect of further upward movements.
Continuing its upward trajectory, the price reached the 100-day moving average of $0.5604, where buyers diligently strive to surpass this pivotal threshold. It is essential to note, however, that despite the existing bullish momentum, the possibility of a rejection followed by a temporary decline cannot be dismissed.
This cautionary stance is rooted in the significance of the 100-day moving average as a substantial resistance level, particularly when coupled with the static resistance region at $0.56.
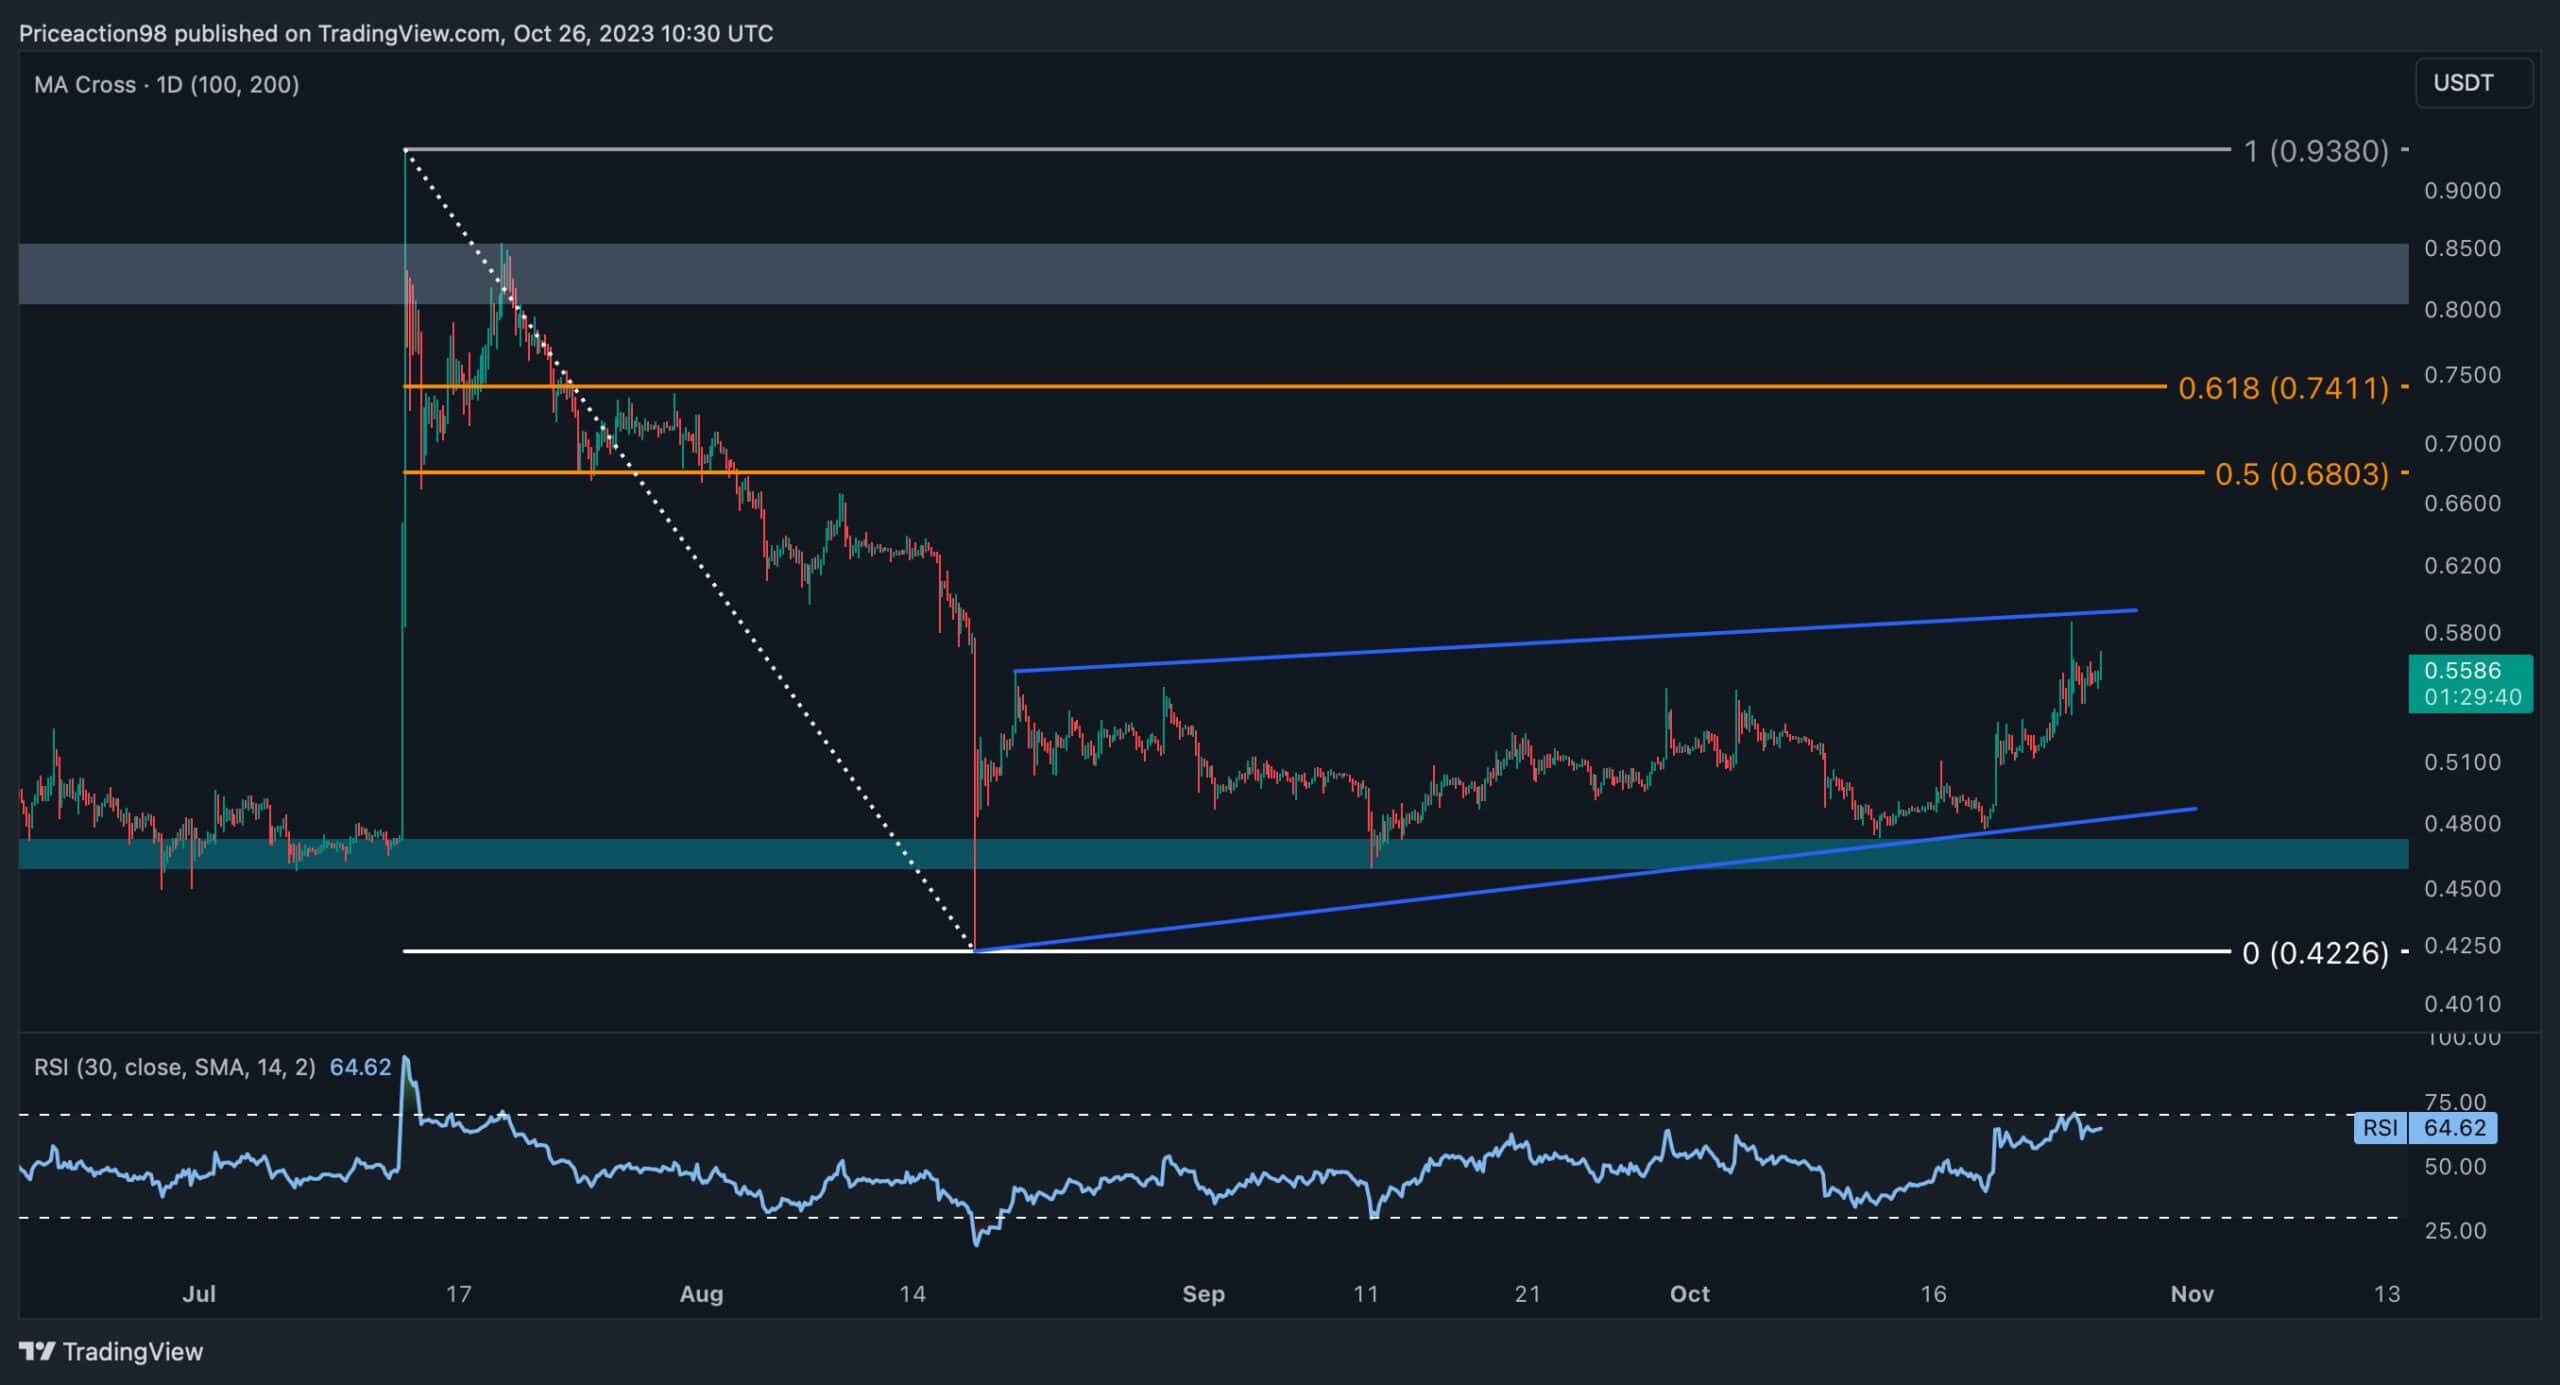
The 4-Hour Chart:
Shifting to the 4-hour chart, a prolonged downtrend discovered substantial support at $0.47, giving rise to a brief phase of lateral price movement. Remarkably, an ascending wedge pattern, widely recognized as a continuation pattern, has become evident.
Presently, the price hangs in the balance, on the verge of breaching the upper boundary of the wedge, a development that can invalidate the pattern and signal a reversal. In a successful breach, the price range bounded by the 0.5 and 0.618 Fibonacci retracement levels emerges as Ripple’s next target. Nevertheless, should the price fail to break through the upper trendline, this scenario would be annulled, thereby creating the possibility of a downward movement.
The post Is XRP Preparing Another Rally to $0.60? (Ripple Price Analysis) appeared first on CryptoPotato.