Is XRP on the Verge of a Massive Move This Week? (Ripple Price Analysis)
Ripple’s price has been trapped in a relatively narrow range against USDT while being in a clear bearish trend against BTC.
Yet, things are looking interesting as the price is seemingly preparing for its next large move.
Technical Analysis
By TradingRage
Ripple Price Analysis: The USDT Paired Chart
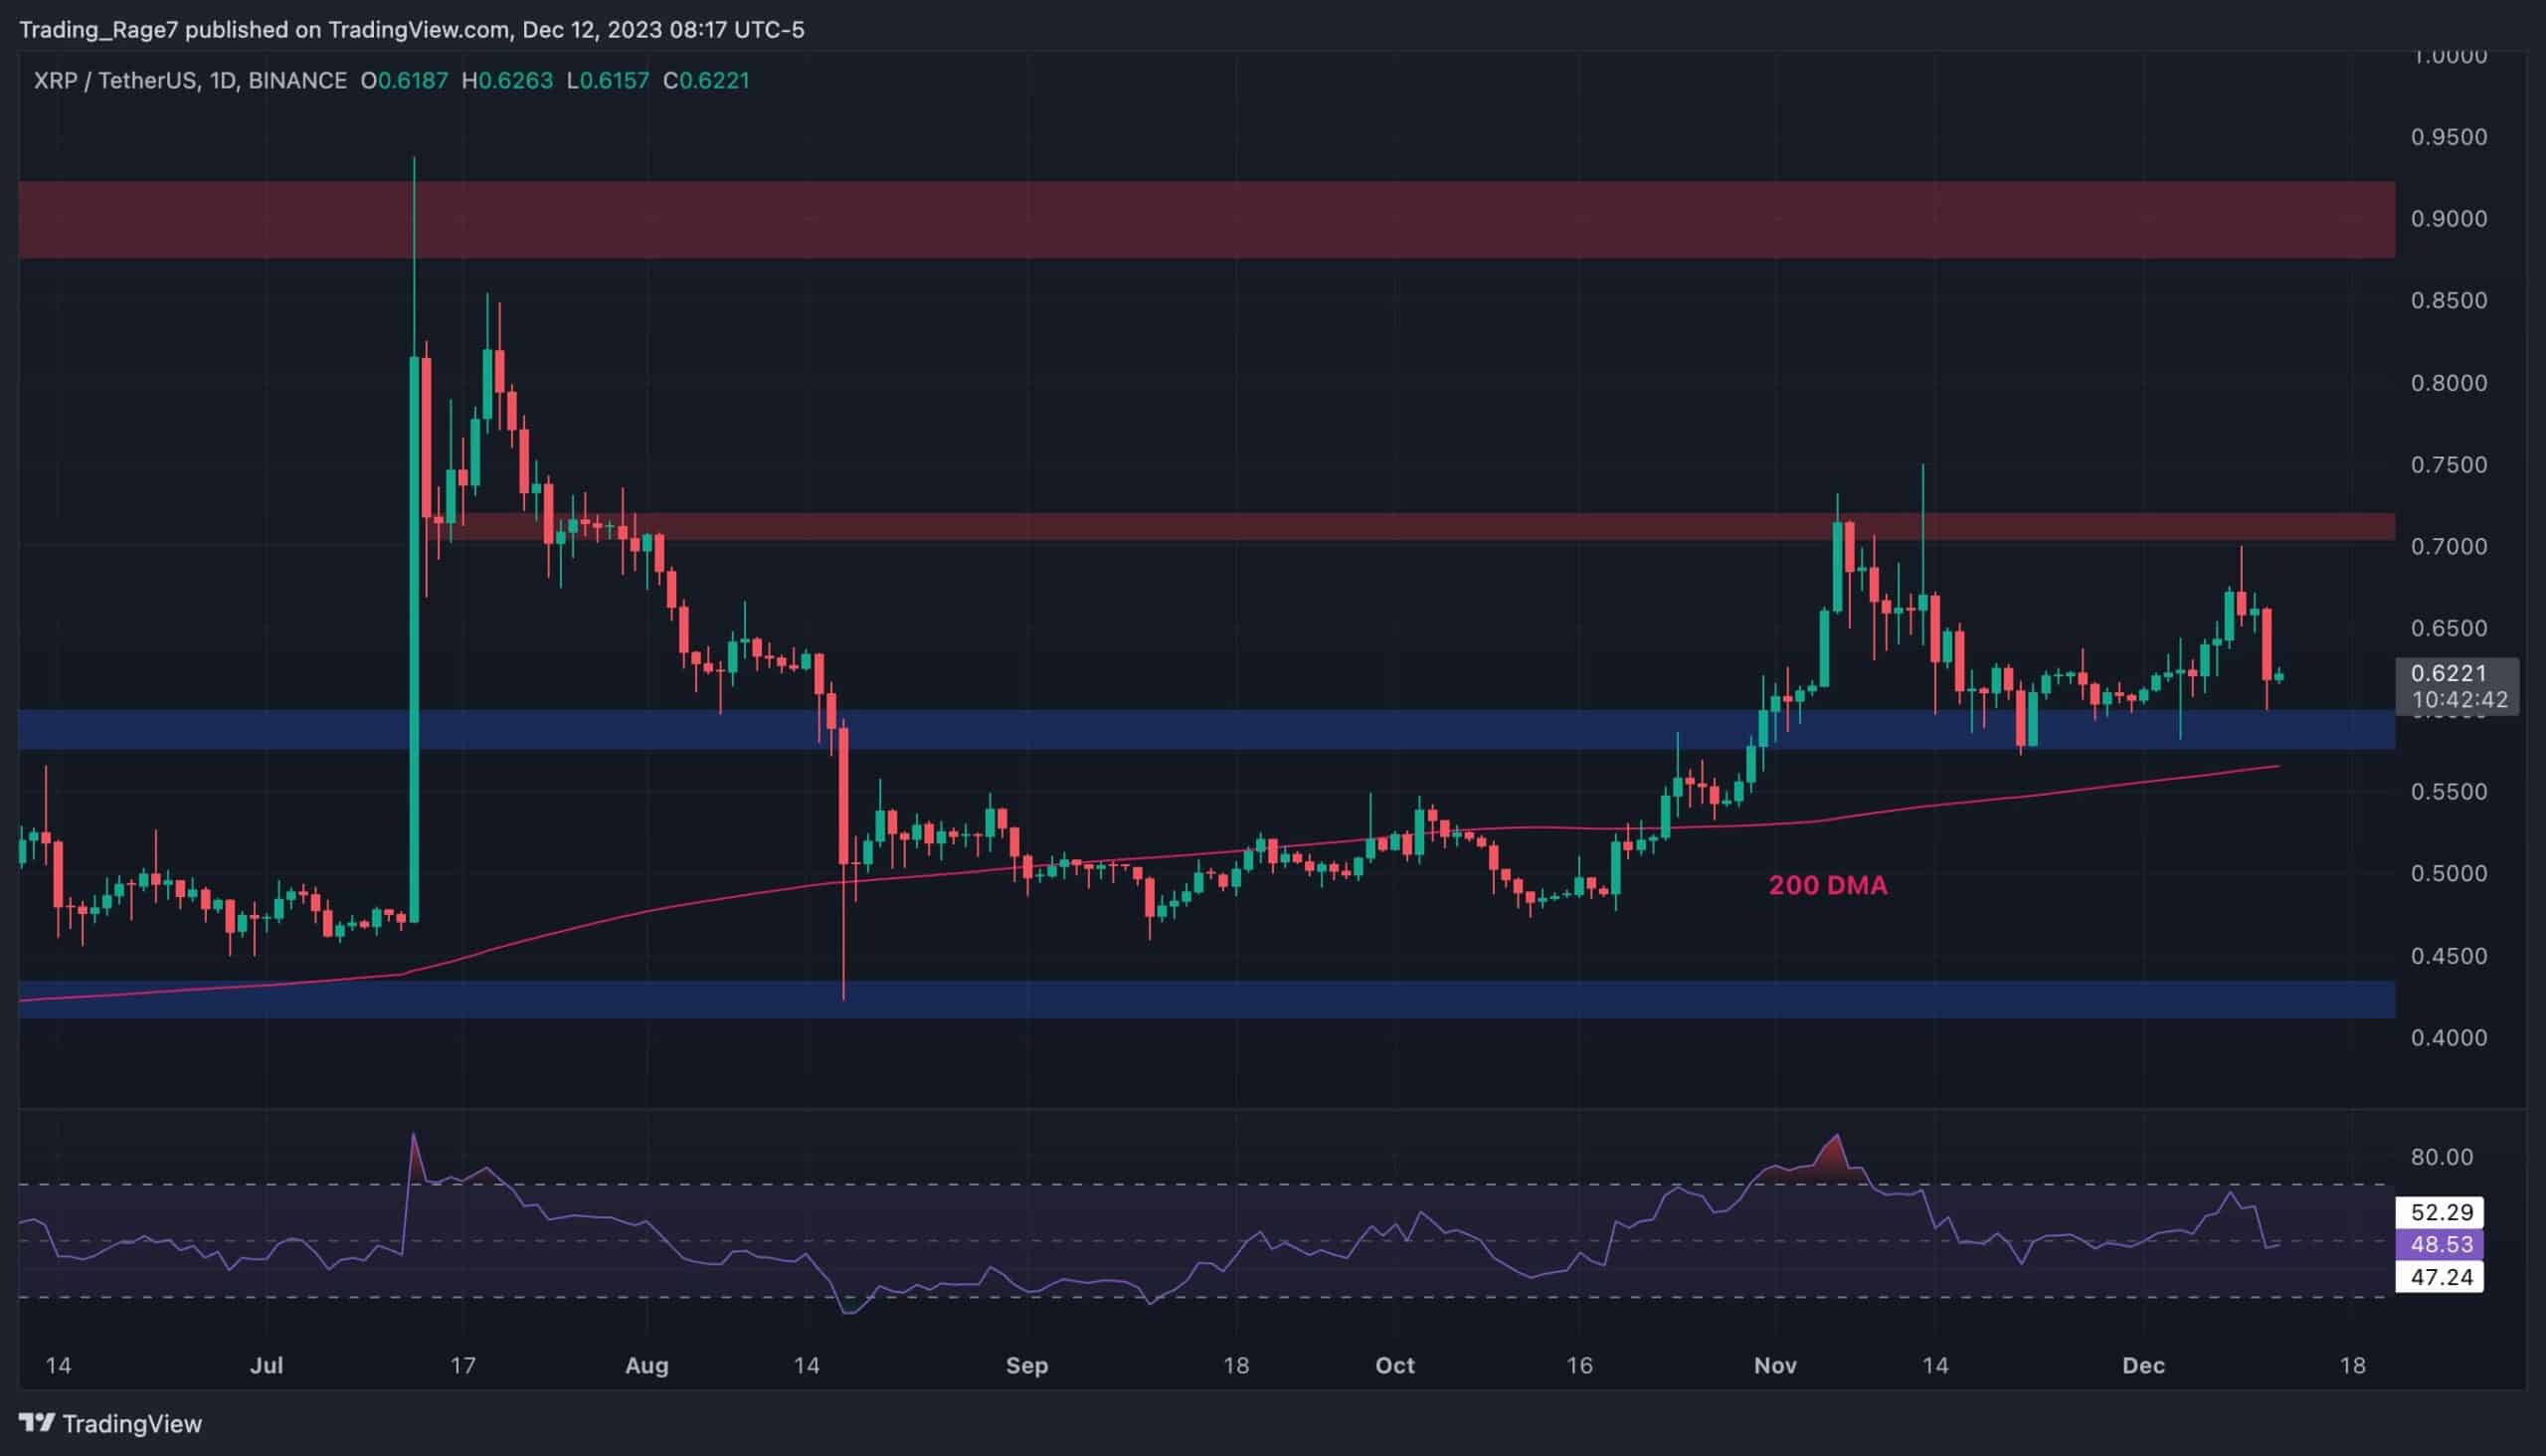
On the USDT paired chart, the price has been oscillating between the $0.60 and $0.72 levels, failing to break to either side. The market is currently testing the $0.60 level once again, approaching it with momentum. However, even with a breakdown of this level, the 200-day moving average, located around the $0.57 mark, is available nearby to provide support.
A drop below this moving average would be disastrous for XRP, as it paves the way for a plunge toward the $0.43 level. The Relative Strength Index has also dropped below 50% recently, indicating that the momentum is bearish and boosting the probability of a further downtrend.

The BTC Paired Chart
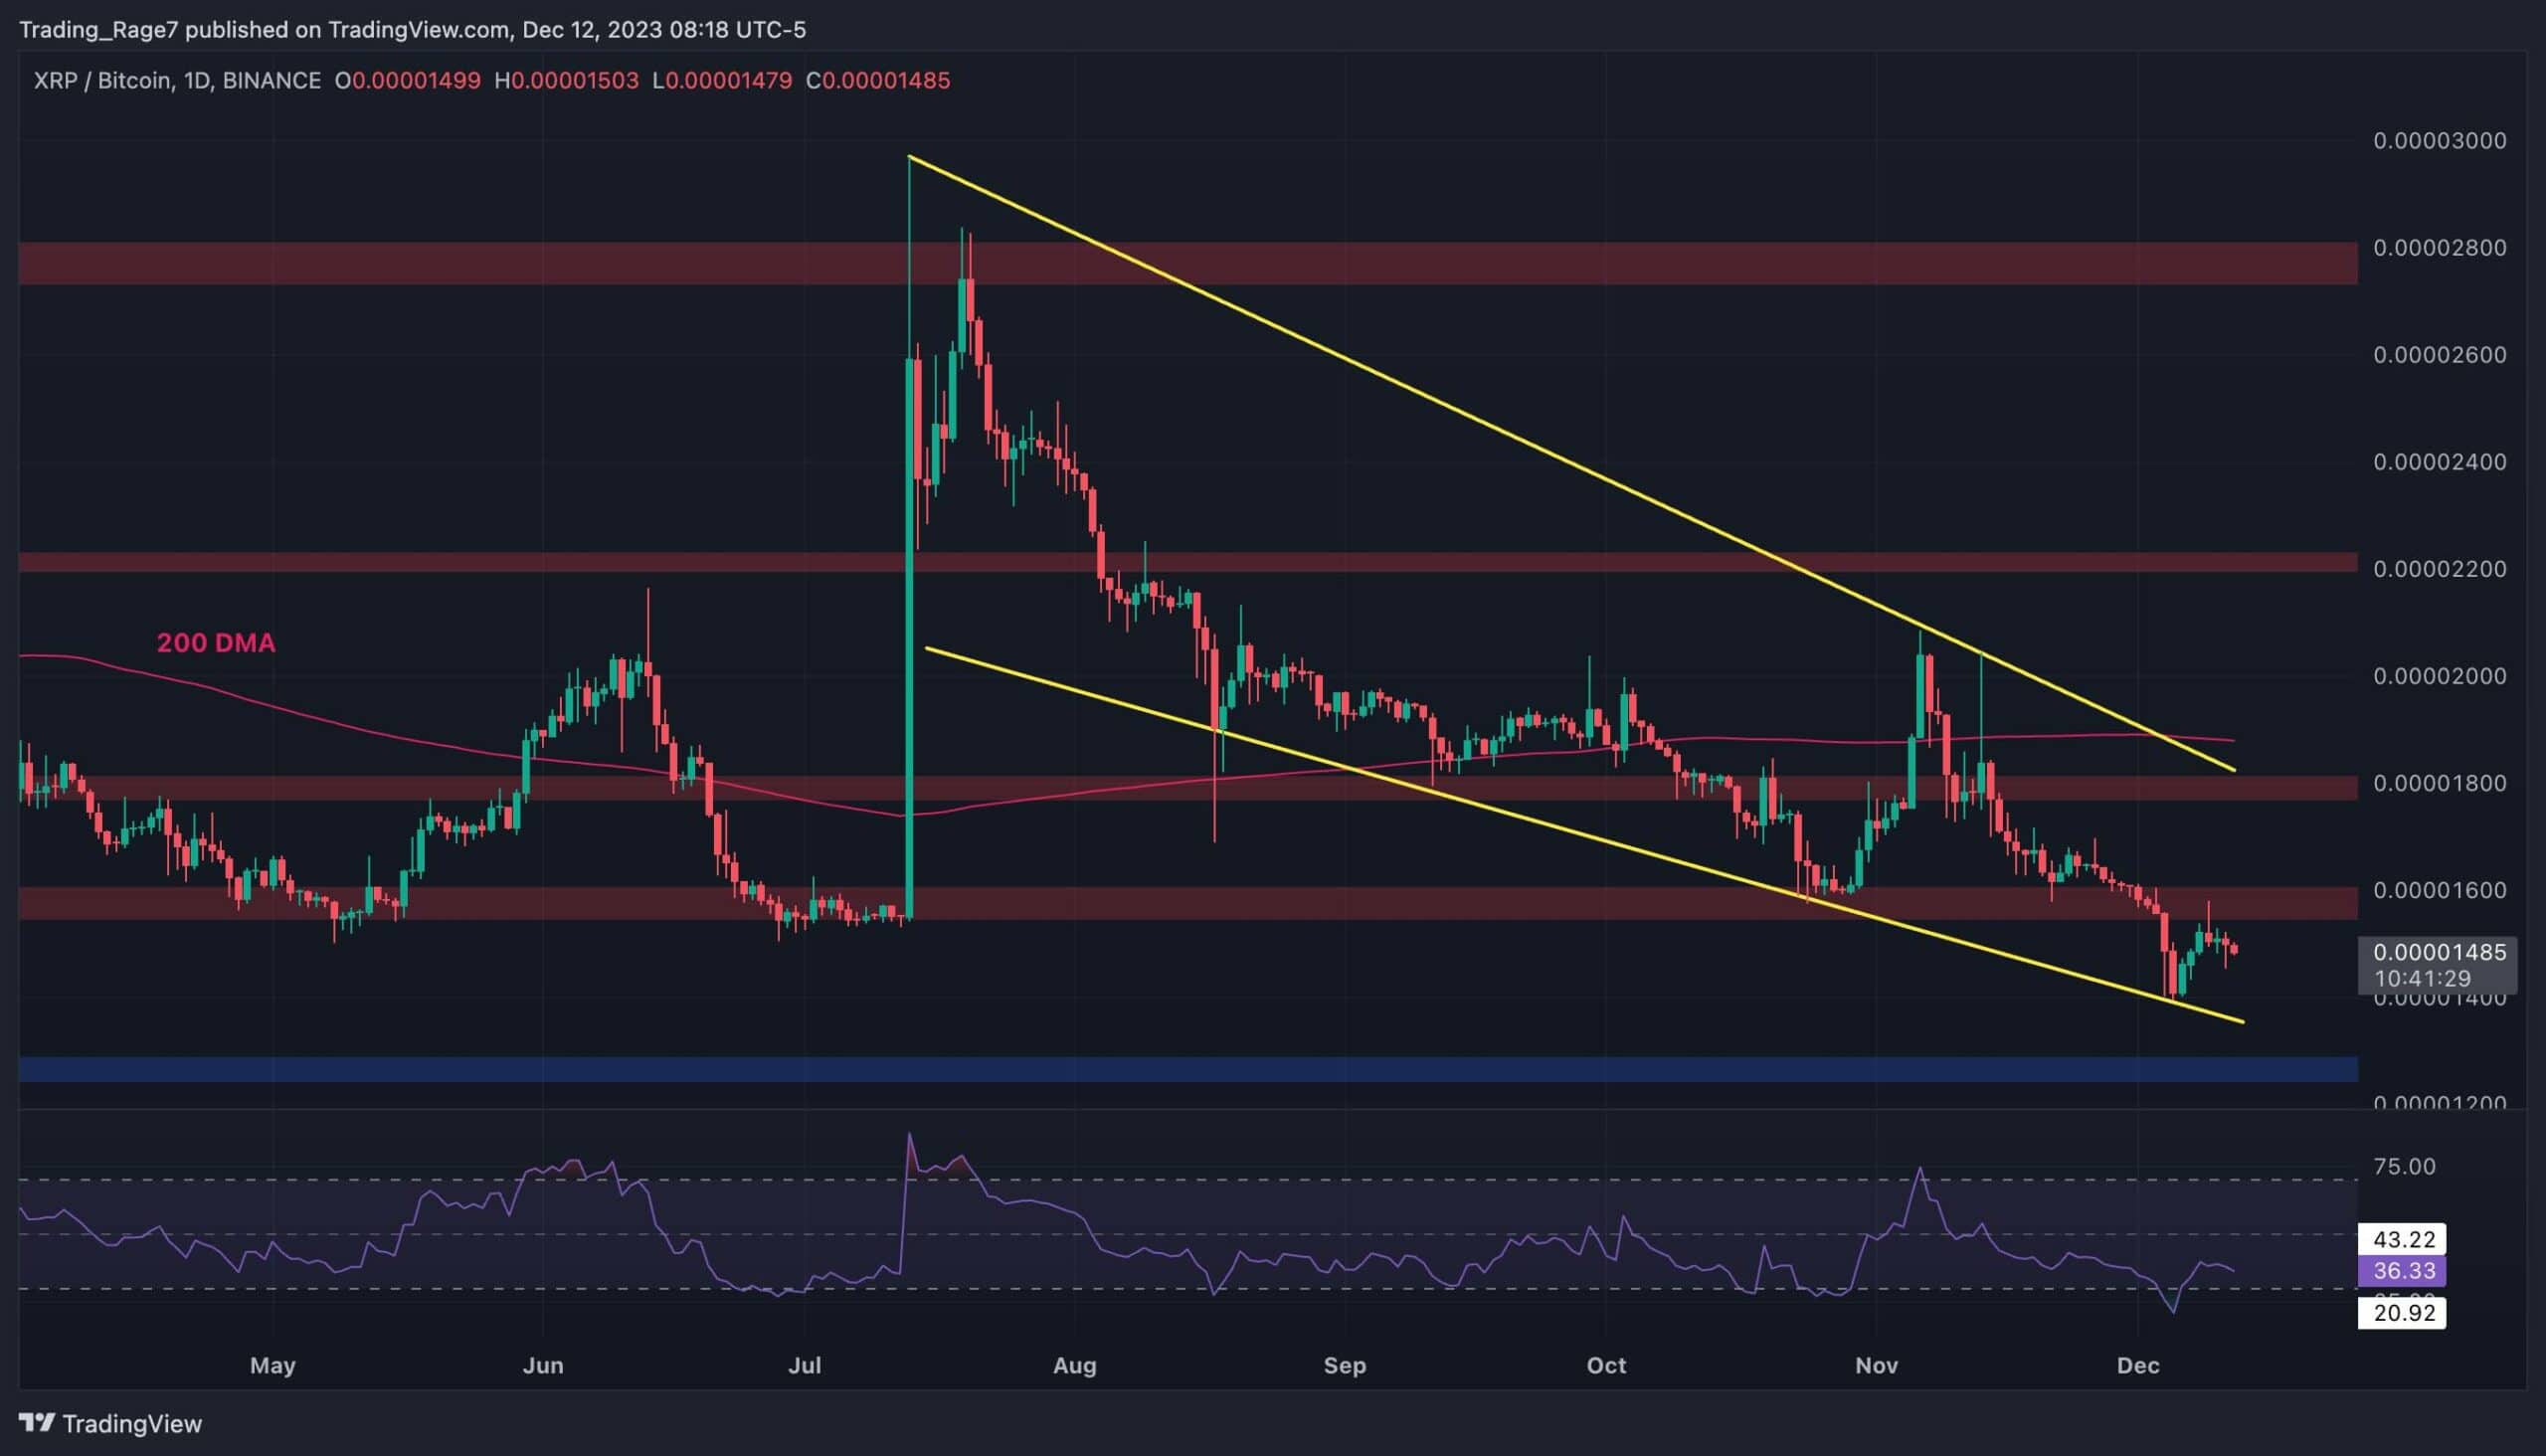
Looking at the Bitcoin pair, things seem troublesome for XRP. The price has been making lower highs and lows over the last few months and is yet to demonstrate any bullish shift in market structure.
Moreover, a large falling wedge pattern has been forming during this period, and the market is seemingly aiming to test its lower boundary once more after a pullback to and rejection from the 1600 SAT resistance level. With the Relative Strength Index confirming clear bearishness in momentum, the decline seems likely to continue in the coming weeks.

The post Is XRP on the Verge of a Massive Move This Week? (Ripple Price Analysis) appeared first on CryptoPotato.


