Is XRP In Trouble or Will The Bulls Finally Reclaim $0.5 For Good? (Ripple Price Analysis)
Ripple’s price has remained relatively stagnant, displaying minimal fluctuations within a narrow range for the past couple of weeks. However, the BTC-paired chart offers a more intriguing perspective.
Technical Analysis
By: Edris
XRP/USDT Daily Chart:
The price of Ripple has been consolidating above the 50-day moving average against USDT, which is located around $0.48, after facing rejection at the $0.6 resistance level once again.
A potential breakdown of the 50-day moving average may lead to a decline toward the $0.43 support level, accompanied by the 200-day moving average.
If these support levels are breached, there is a likelihood of a significant drop towards the $0.3 range. However, it is premature to adopt such a pessimistic outlook, as there remains a possibility for a price rebound and another attempt at testing the $0.6 level.
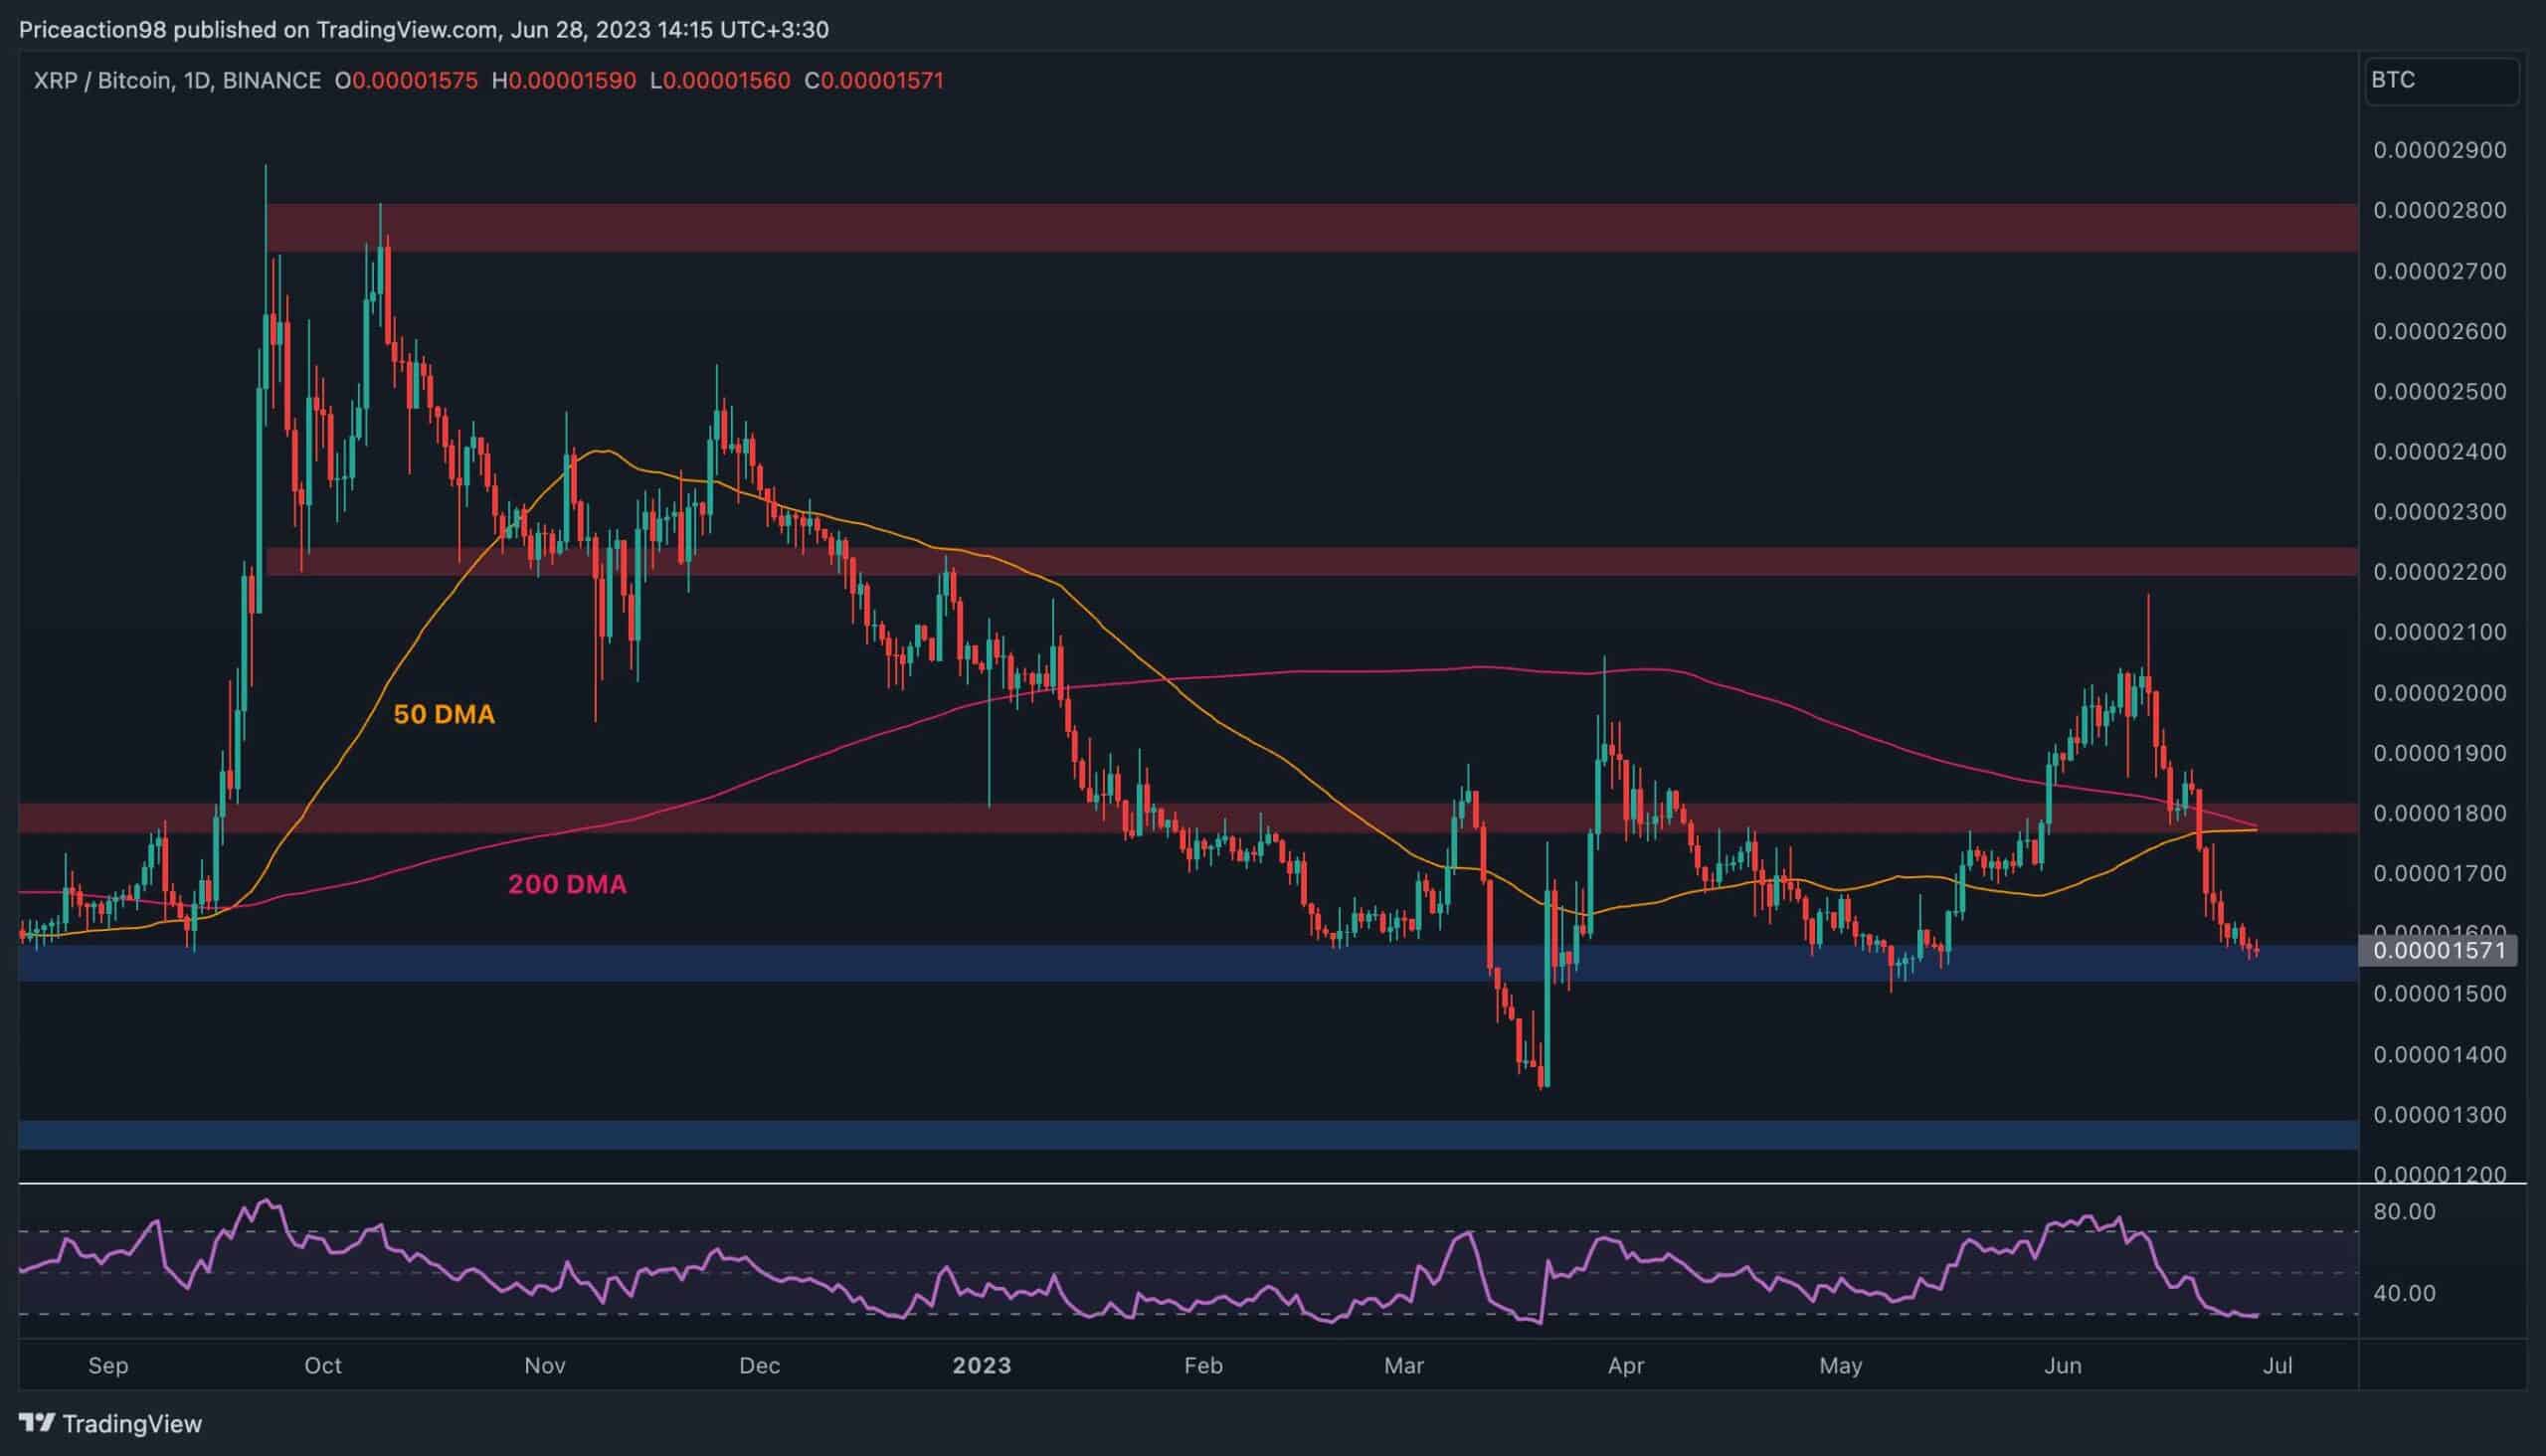
XRP/BTC Daily Chart
The price of Ripple against BTC has been experiencing a continuous decline in recent weeks.
Both the 200-day and 50-day moving averages have been breached downward, with the price currently testing the support level at 1500 SAT.
If there is a rebound from the support zone, the initial targets for XRP would be the converging 200-day and 50-day moving averages around the 1800 SAT resistance level.
Additionally, the RSI indicator suggests an oversold condition, implying the potential for a short-term pullback or rebound.
The post Is XRP In Trouble or Will The Bulls Finally Reclaim $0.5 For Good? (Ripple Price Analysis) appeared first on CryptoPotato.