Is the SHIB Bull Run in Danger Following 250% Monthly Gains? (Shiba Inu Price Analysis)
Shiba Inu tried to break higher, but failed so far.
Key Support levels: $0.0000025
Key Resistance levels: $0.000037
1. Key Resistance Halts the Rally
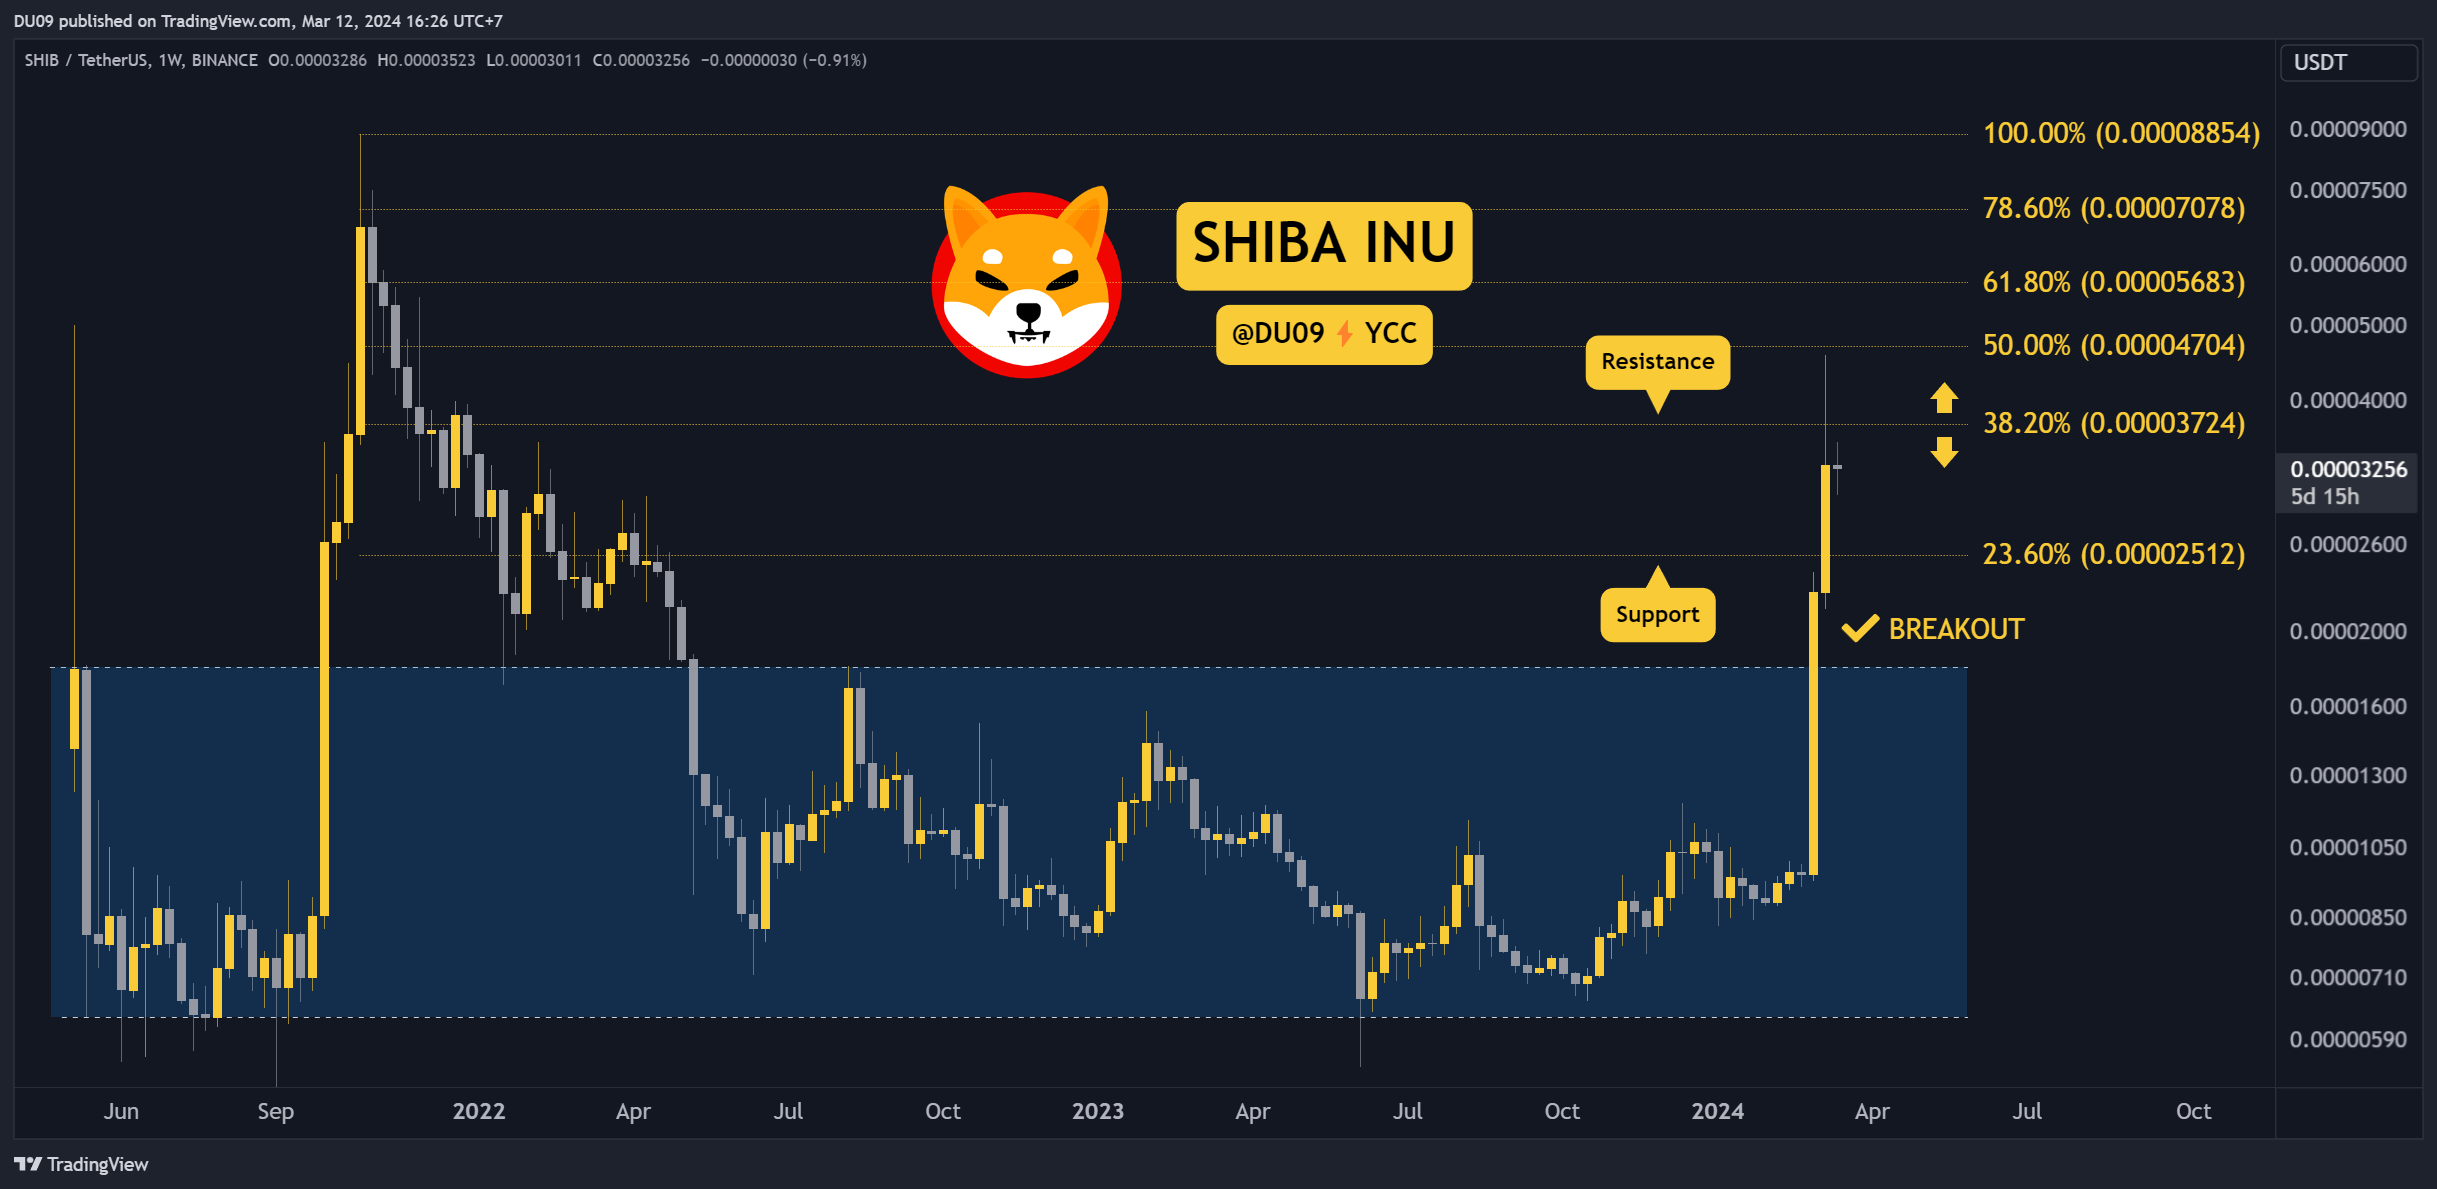
After an impressive rally, SHIB’s price seems to be taking a break under the key resistance at $0.000037. Buyers were unable to break above this level and the price ended up moving sideways.
2. Sellers Returning or Just a Break?
The bullish momentum is taking a pause, but this also opens up an opportunity for sellers to return. If buyers don’t challenge the current resistance to break it soon, then bears may be encouraged to take SHIB to the key support at $0.000025.

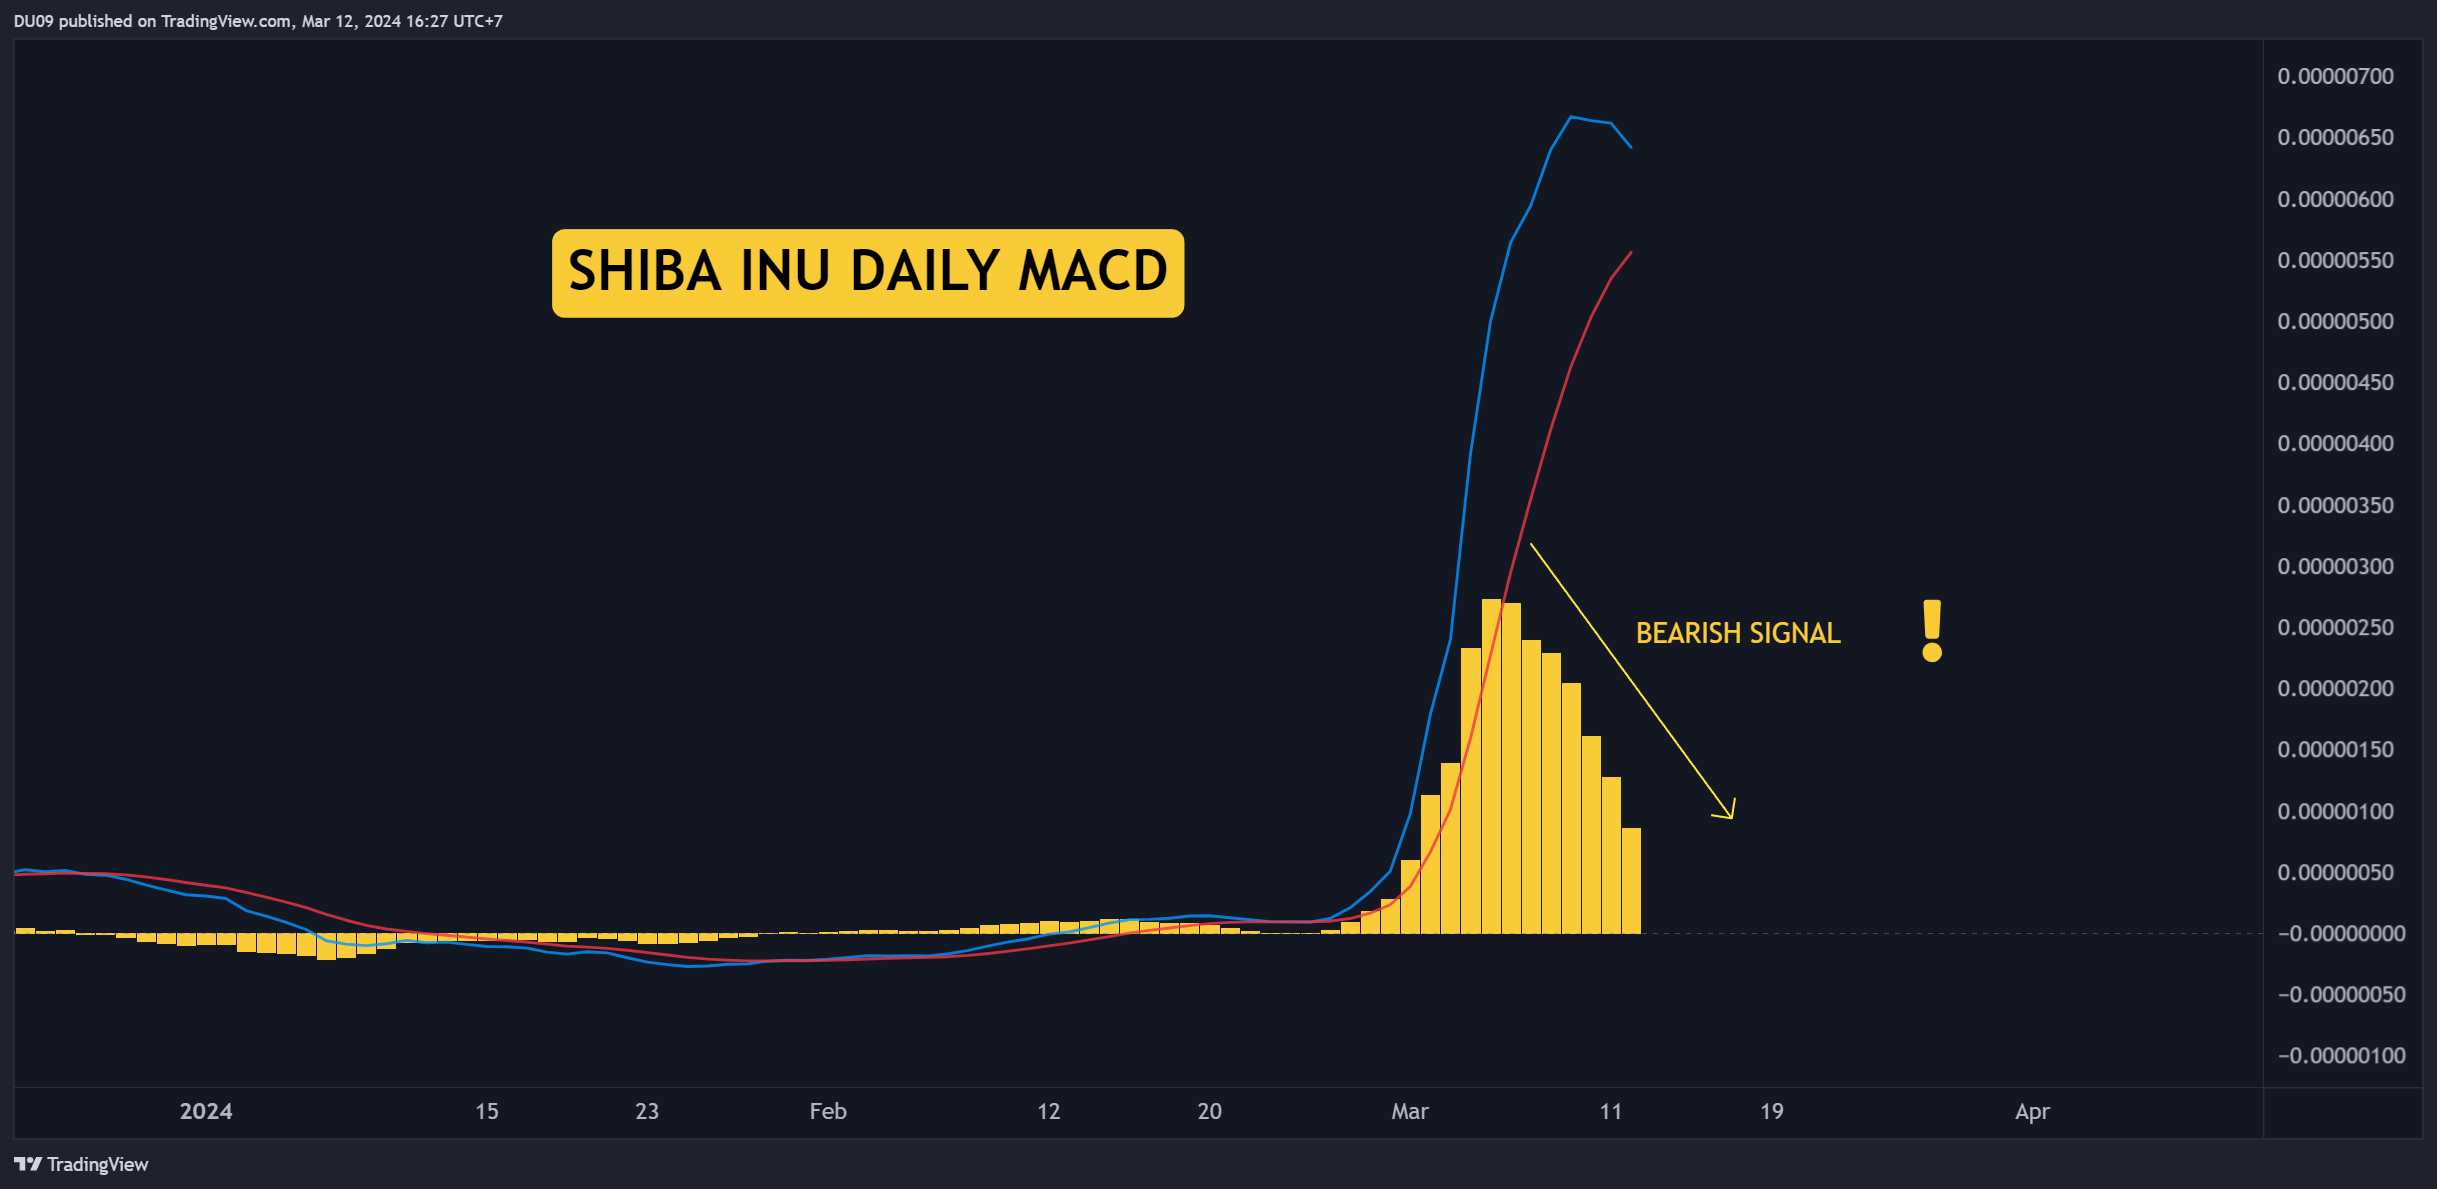
3. Daily MACD Gives Bearish Signs
The daily MACD histogram is making lower highs. This is an early bearish signal. If the moving averages also make a bearish cross, then SHIB’s price may test the current support level before buyers return.
Bias
The bias for SHIB is neutral.
Short-Term Prediction for SHIB Price
Considering the price tripled in a week, a consolidation at this time is a healthy and expected move from Shiba Inu. As long as the key support at $0.000025 holds, then buyers can try to break higher later.
The post Is the SHIB Bull Run in Danger Following 250% Monthly Gains? (Shiba Inu Price Analysis) appeared first on CryptoPotato.


