Is SHIB In Trouble? Watch These Three Things This Week (Shiba Inu Price Analysis)
Shiba’s price is continuing to range without a significant move to date.
Key Support levels: $0.0000070
Key Resistance levels: $0.0000075, $0.0000080
1. Price is Stuck in a Range
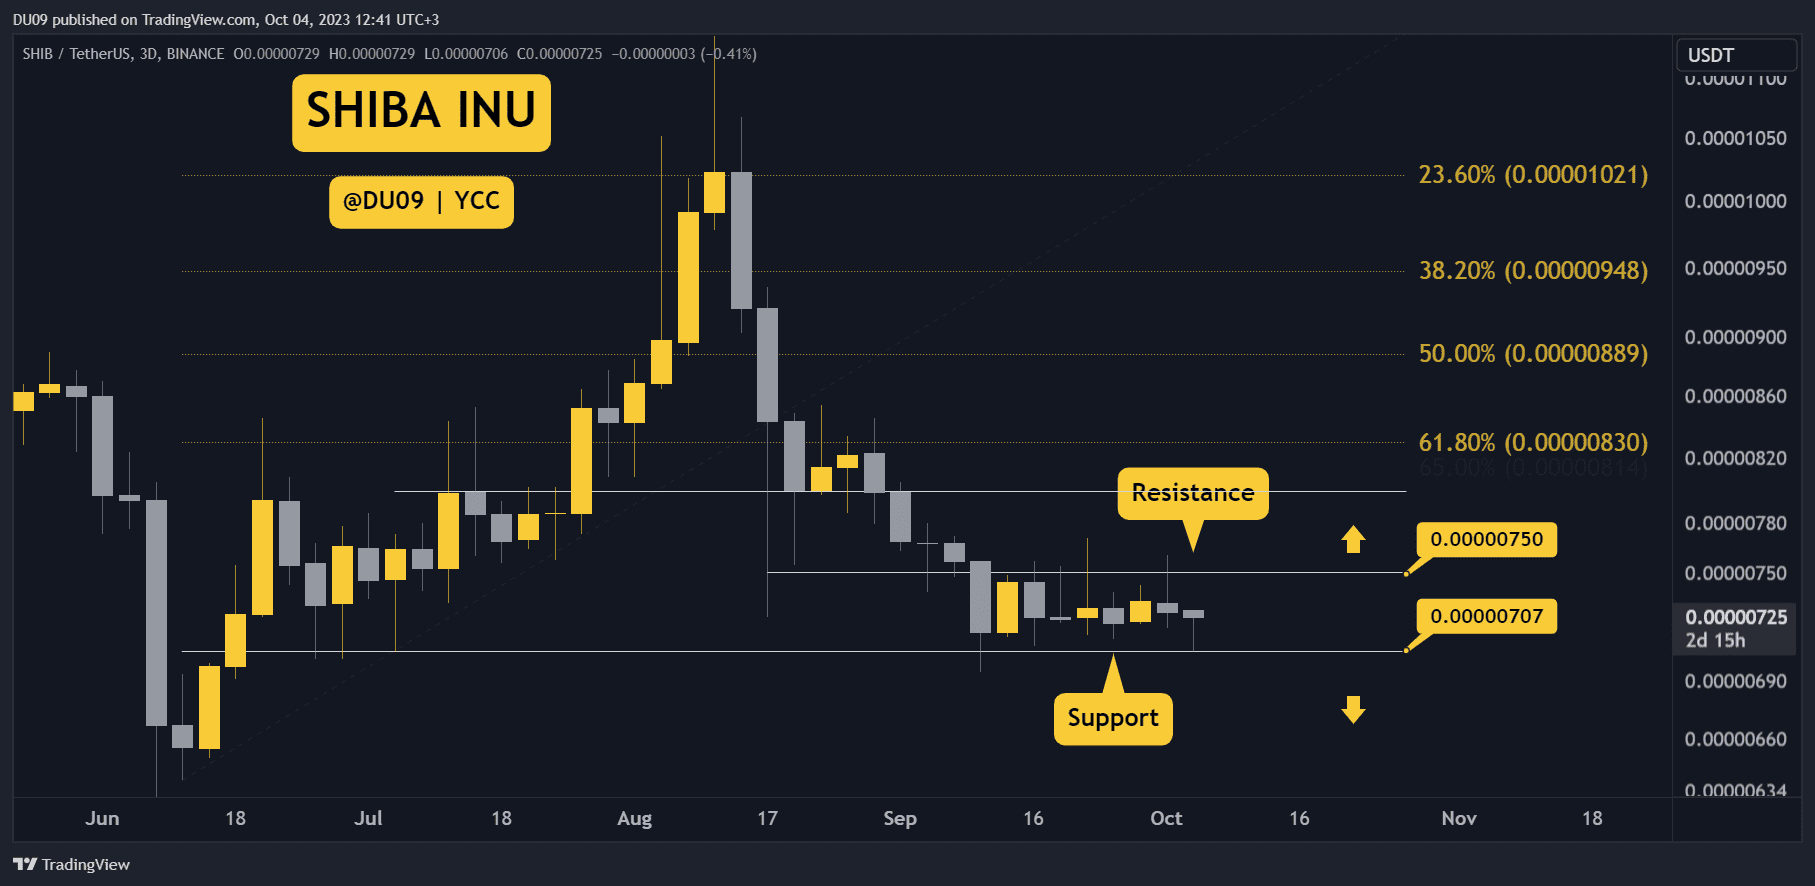
SHIB’s price has not moved much above the key support at $0.0000070. This pause in volatility may continue for some time as BTC decides where to go next. The price is still in a range, and without a clear breakout, the spotlight may not return on this meme coin for some time.
2. Volatility is Absent
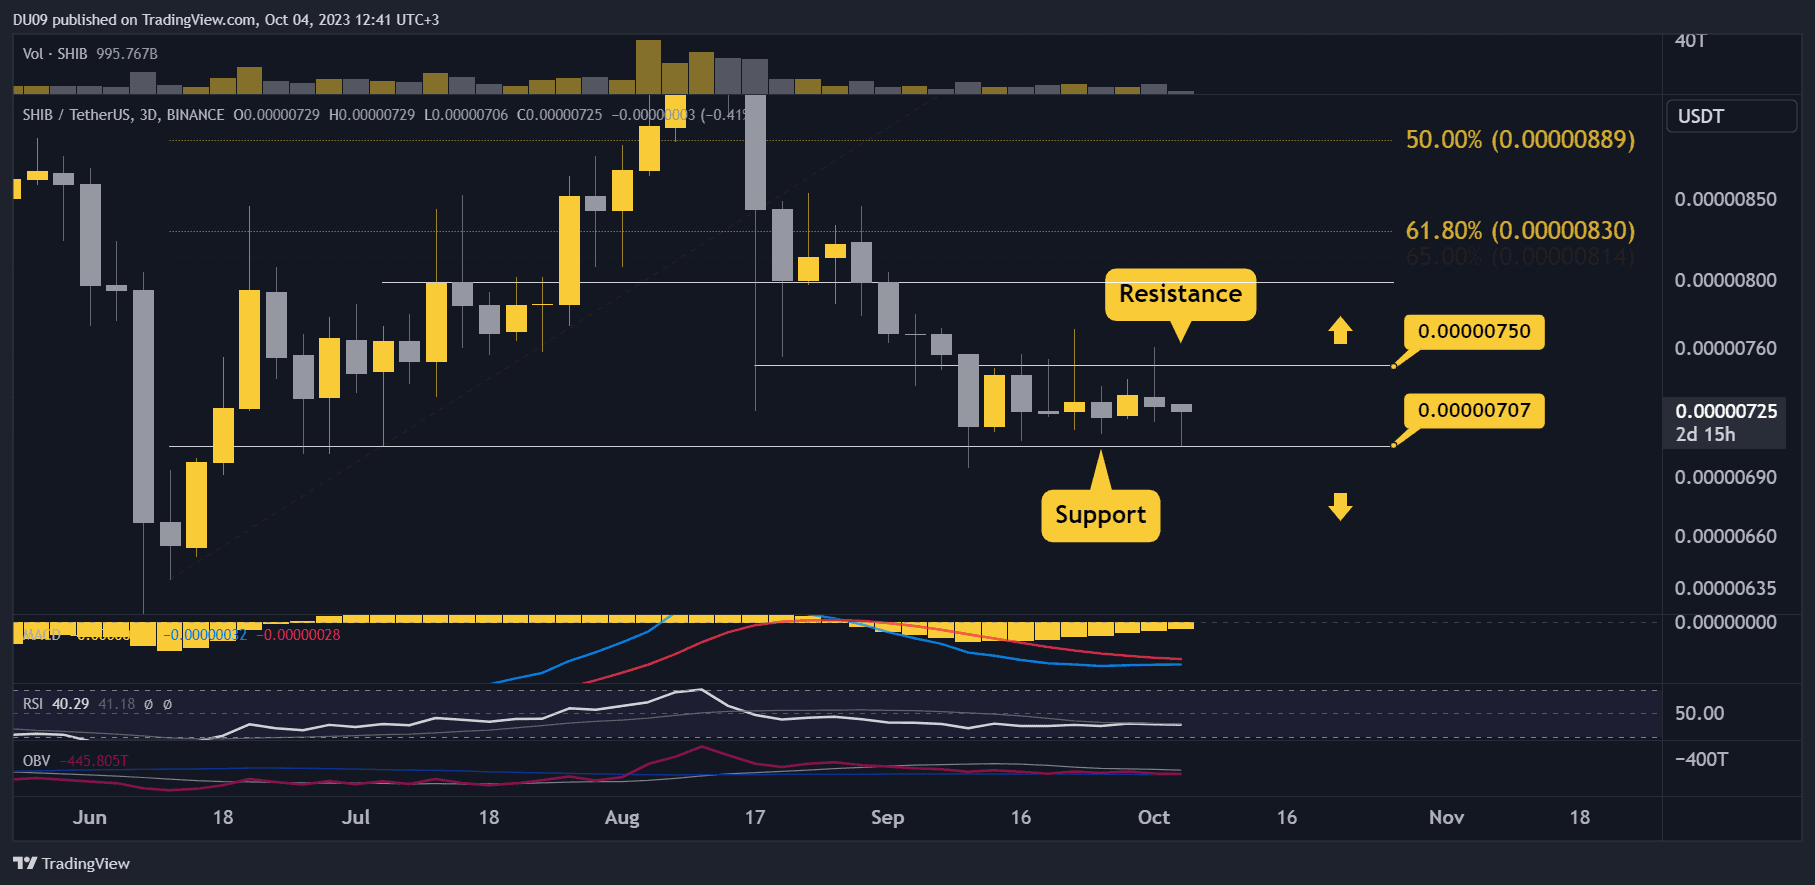
While the price bounced a few percentages from the current key support, it did not venture far, and the resistance is still holding strong at $0.0000075. Without buyers returning, this is unlikely to change any time soon.
3. Volume is Flat
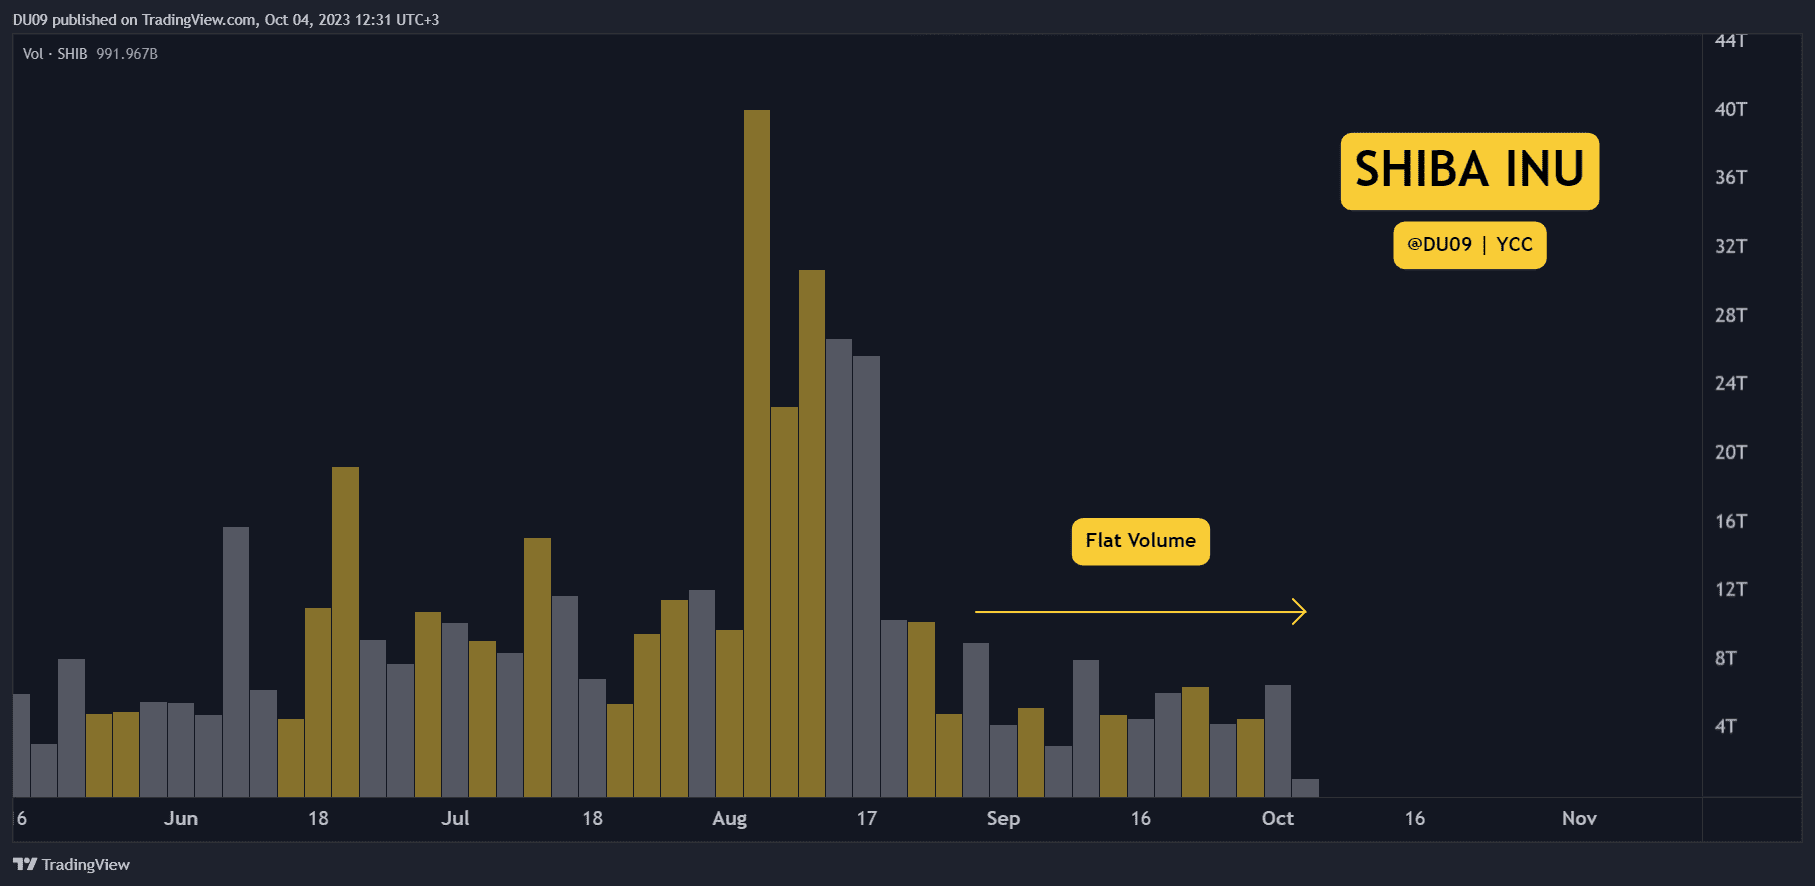
As you can see below, there has been a minimum change in volume since September. If that continues to be the case, it’s unlikely that Shiba Inu will make some progress soon. It had an opportunity to move higher when Bitcoin broke above $28,000, but that did not materialize.
Bias
The bias for SHIB is neutral.
Short-Term Prediction for SHIB Price
Watch closely the key support at $0.0000070. So long it holds, this consolidation will continue. Considering the current volume, don’t expect the resistance at $0.0000075 to be broken any time soon.
The post Is SHIB In Trouble? Watch These Three Things This Week (Shiba Inu Price Analysis) appeared first on CryptoPotato.


