Is Ripple in Danger of Crashing Below $0.60? (XRP Price Analysis)
After encountering resistance at the $0.74 level, Ripple underwent a corrective phase, retracing toward the 100-day and 200-day moving averages at approximately $0.55. Nevertheless, the cryptocurrency is currently grappling with low market activity, contributing to modest price volatility.
XRP Analysis
By Shayan
Ripple Price Analysis: The Daily Chart
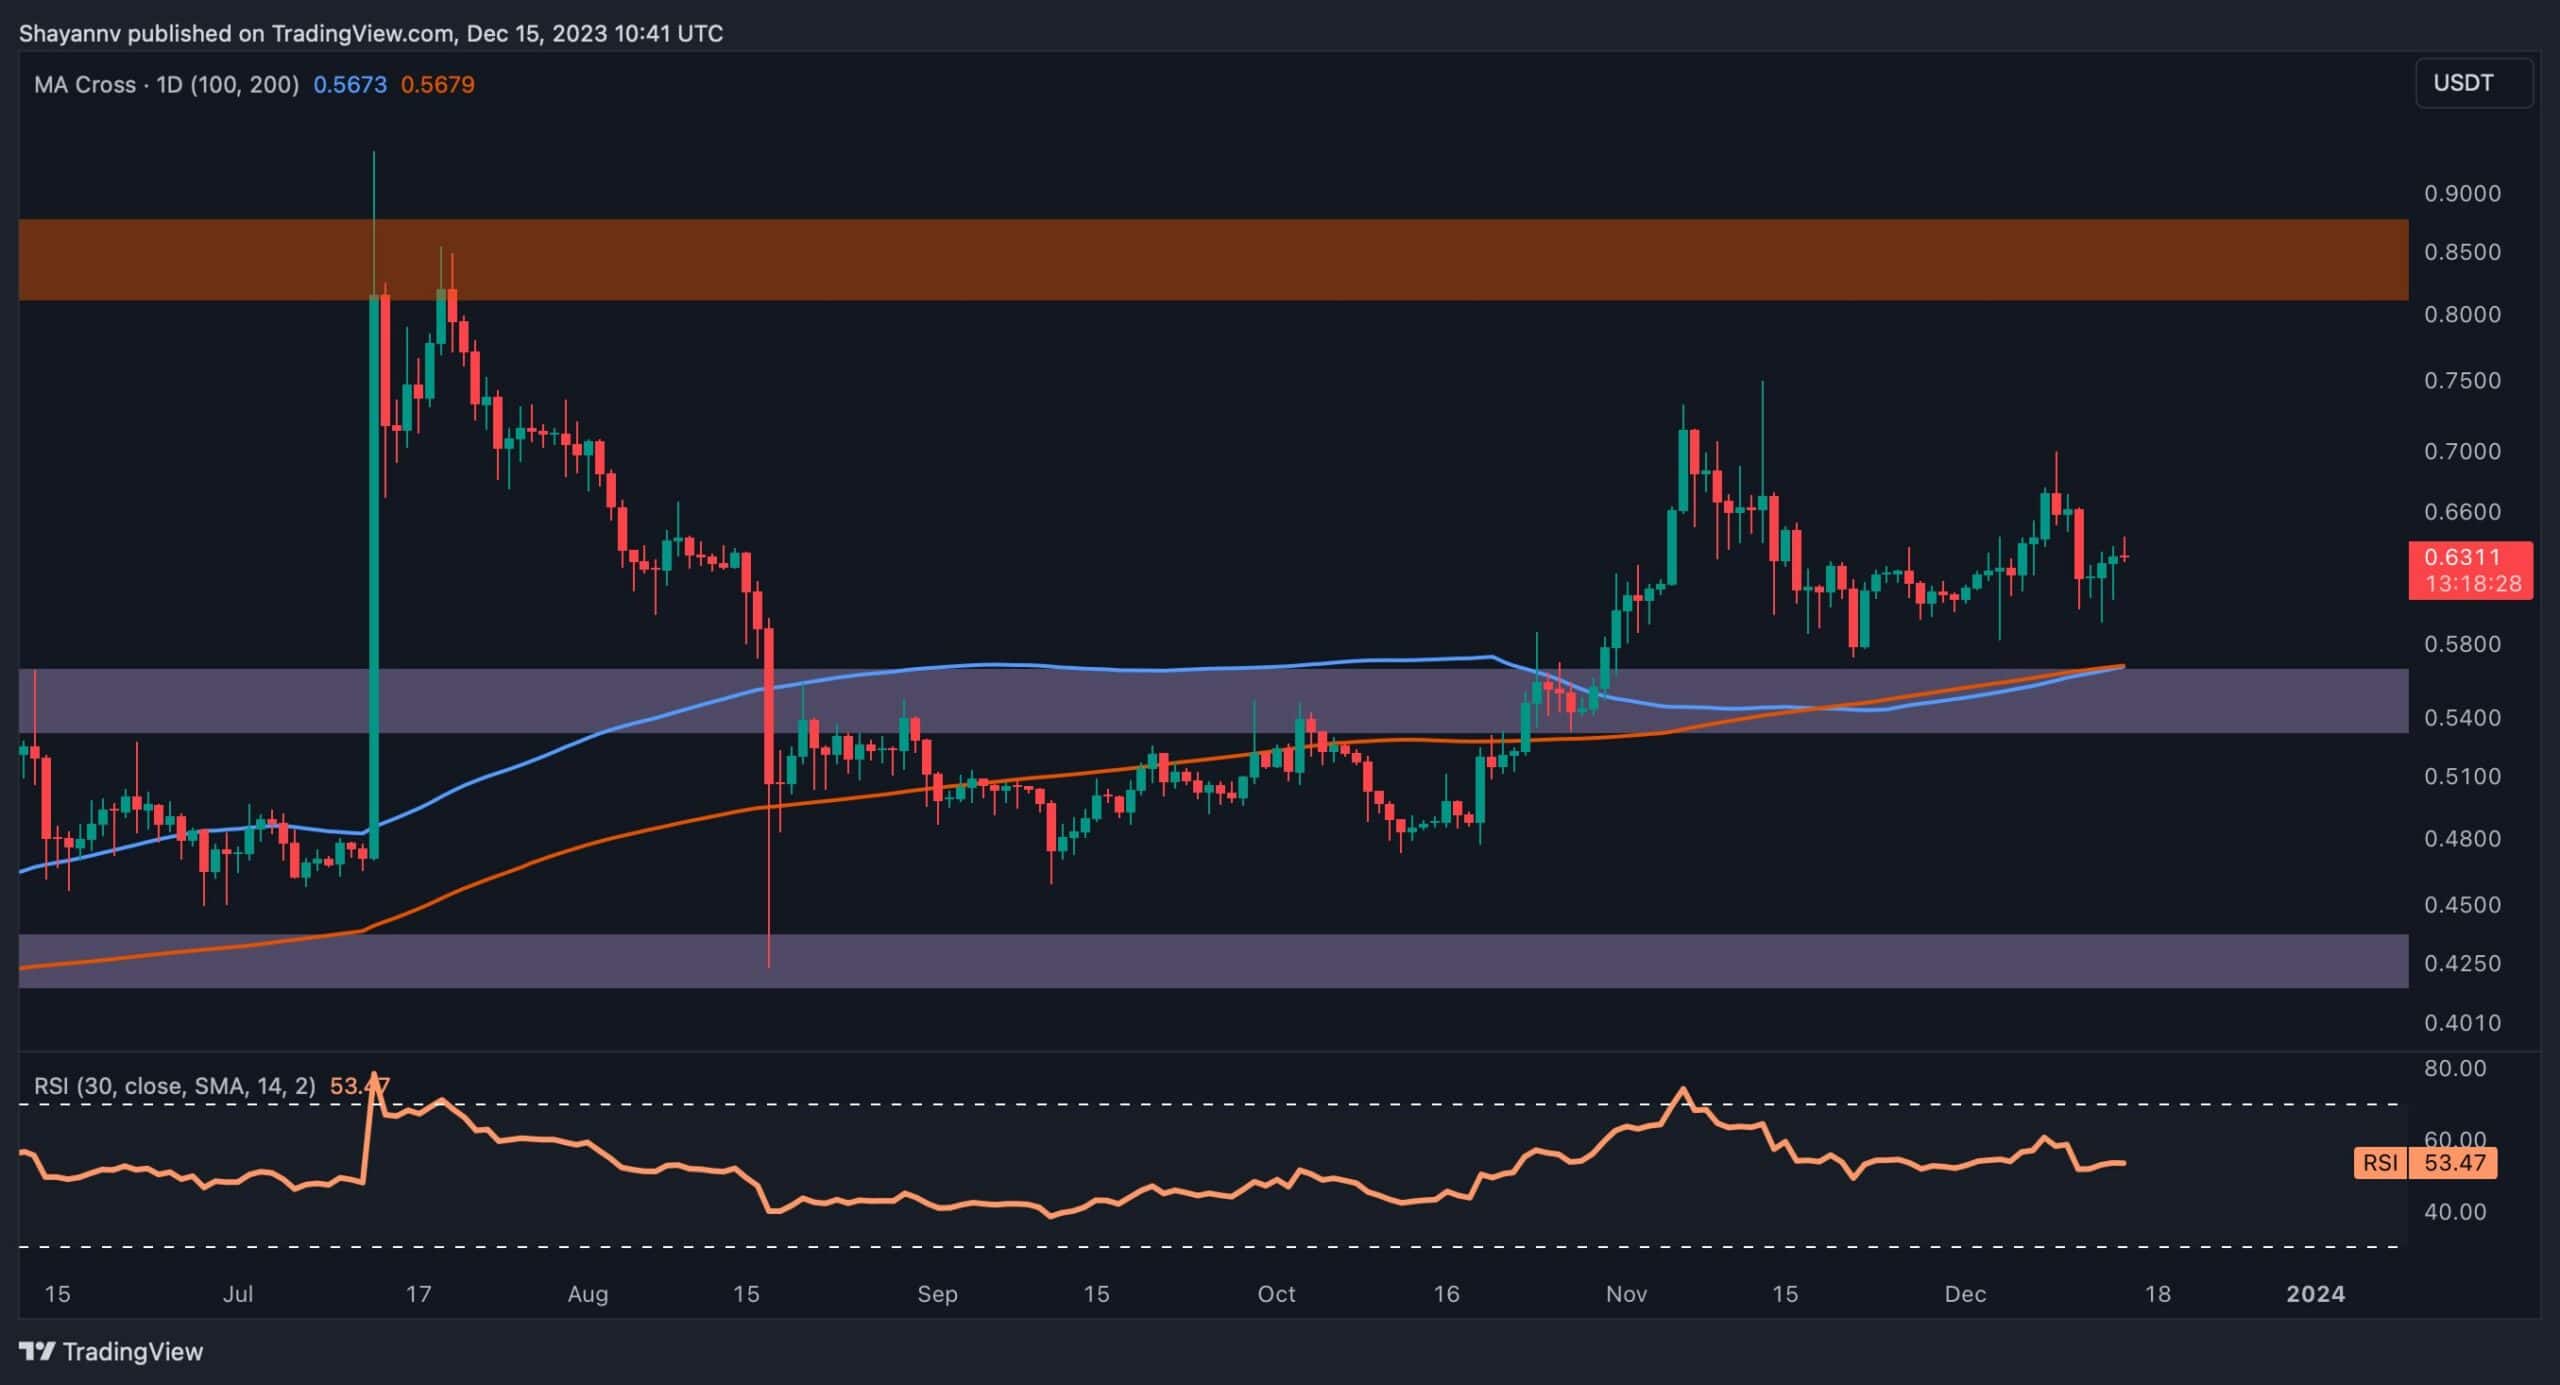
A closer look at the daily chart reveals that Ripple faced resistance and seller dominance in its attempt to breach the $0.74 mark, leading to a corrective phase with a retracement towards a pivotal support zone. This critical range includes the 100-day and 200-day moving averages, coupled with the static support level of $0.56, providing substantial psychological backing for XRP.
Despite this, the XRP price is currently experiencing subdued volatility, remaining confined within a crucial range delineated by the $0.56 support and the $0.74 resistance. However, a resurgence of buying interest supporting Ripple’s price could potentially trigger a renewed uptrend, aiming to reclaim the $0.74 resistance threshold.
The 4-Hour Chart
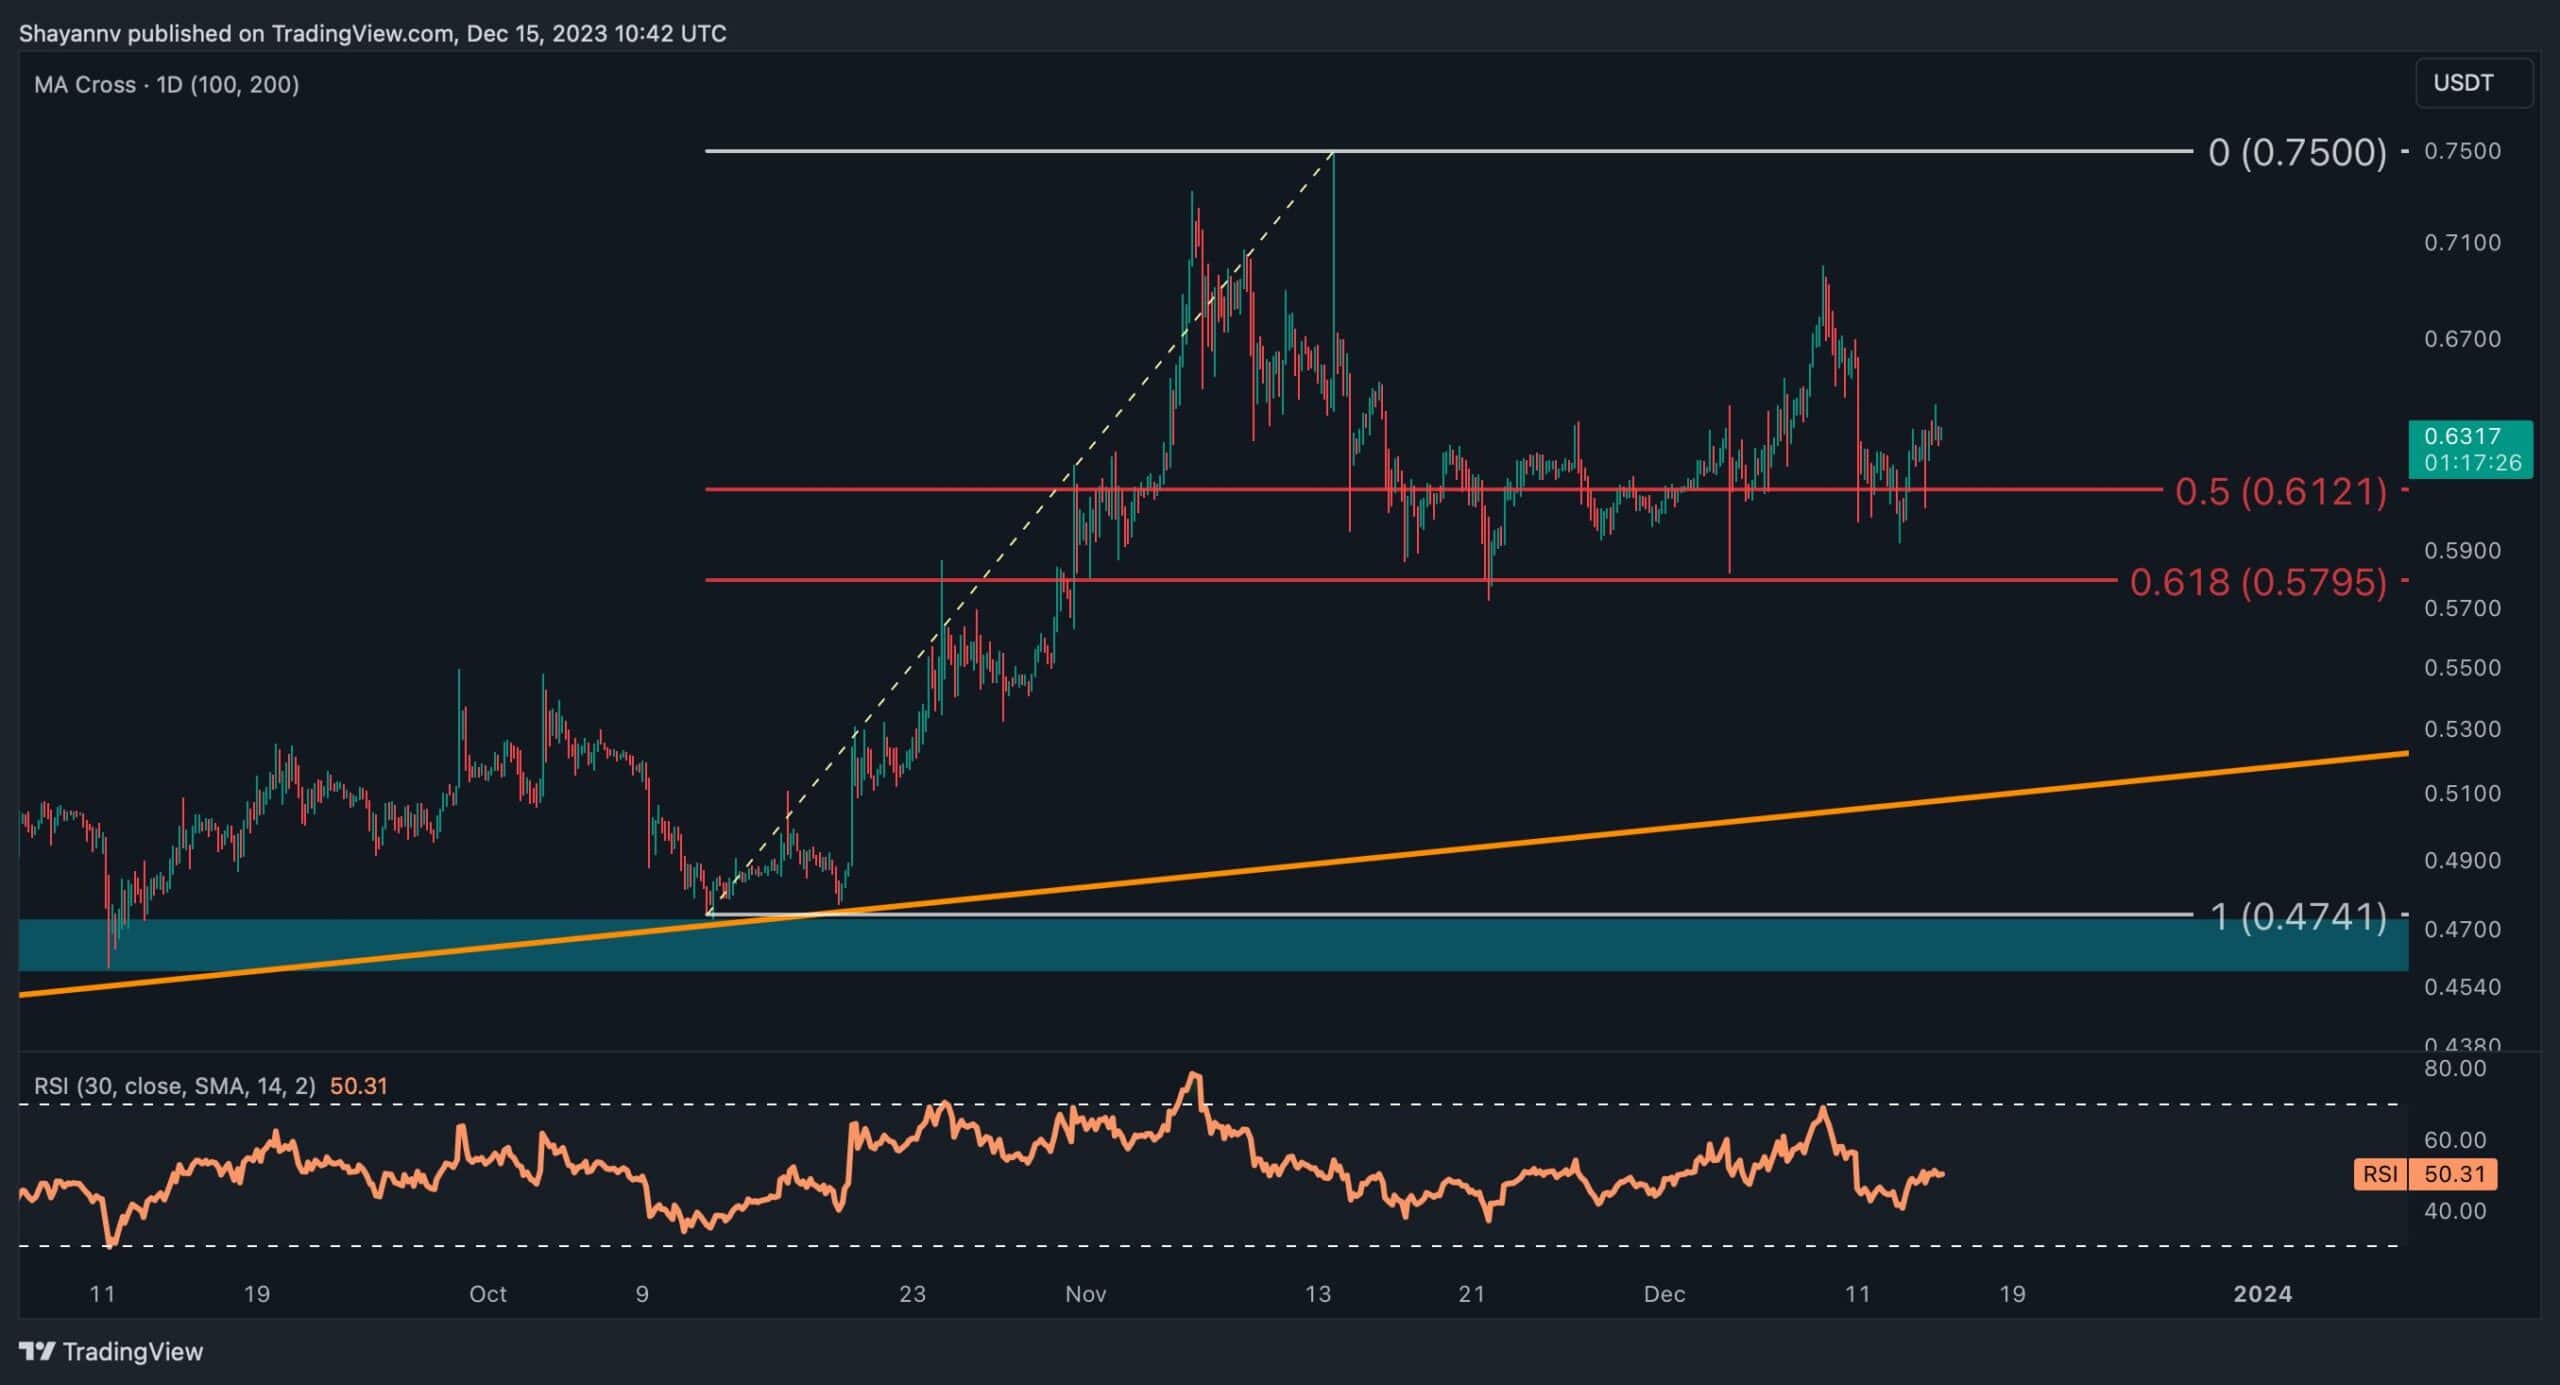
Examining the 4-hour chart, Ripple’s ascent faced significant resistance around the $0.74 level. Heightened selling pressure in this critical region led to a notable decline, characterized by an extended retracement towards the 0.5-0.618 Fibonacci levels.
Despite subsequent attempts by buyers to push the price beyond the $0.74 threshold, these efforts proved unsuccessful. This price action signifies market uncertainty, with Ripple undergoing a consolidation phase accompanied by low volatility.
Nevertheless, substantial support is evident in the price range between the 0.5 and 0.618 Fibonacci levels. A potential decline below this critical range could signal an imminent significant downturn for XRP, and market participants should brace for notable changes under such circumstances.
The post Is Ripple in Danger of Crashing Below $0.60? (XRP Price Analysis) appeared first on CryptoPotato.