Is Mantra (OM) Headed for Another Rally After Hitting a New ATH? (Analysts)
TL;DR
- Despite a broad market downturn with major altcoins like XRP, DOGE, and SOL suffering steep losses, MANTRA (OM) has surged by double digits over the last week.
- While bullish voices advocate for a “buy and hold” strategy, the RSI rising above 70 signals a possible pullback.

‘Just Buy It and Hold It’
The cryptocurrency market has been bleeding heavily in the past several days, with numerous leading altcoins charting substantial losses. Ripple’s XRP, for instance, has tumbled by over 7% weekly, Dogecoin (DOGE) has dropped by 10%, while Solana (SOL) has collapsed by 12%.
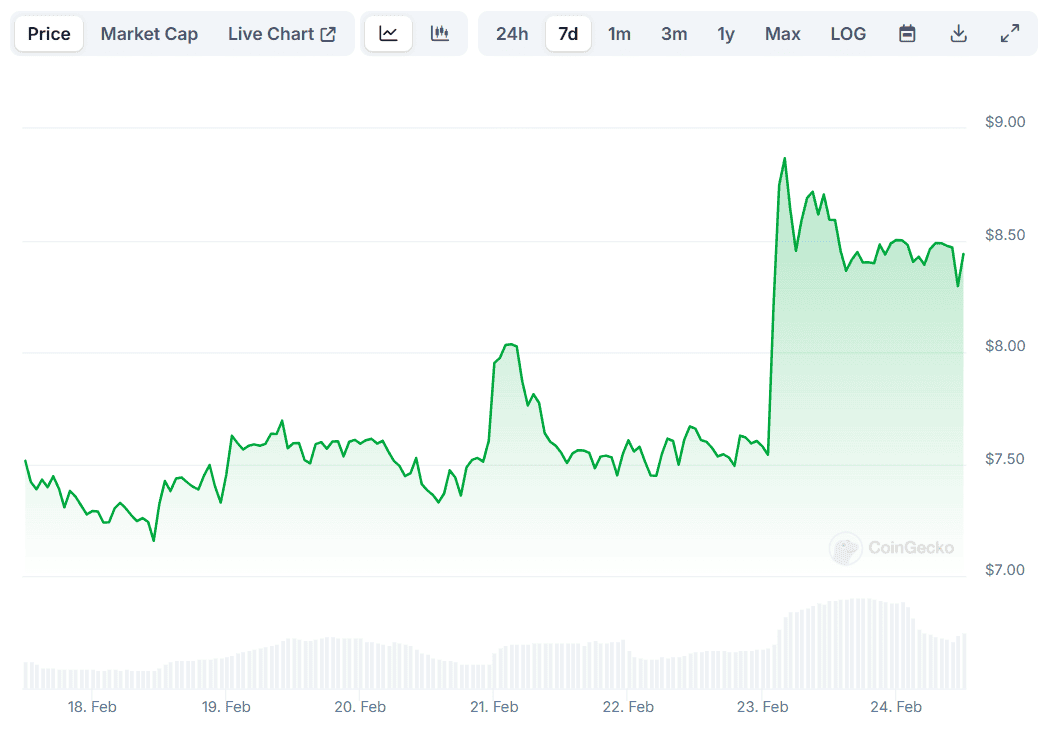
However, it’s not all doom and gloom, and a few assets remain in green territory. One example is MANTRA (OM), whose price has increased by 12.5% on a seven-day scale. It hit a new all-time high of almost $8.90 (per CoinGecko’s data) on February 23, whereas it currently trades at roughly $8.44.
One factor potentially contributing to OM’s recent rally could be MANTRA’s expansion in the Middle East. Several days ago, the entity obtained a Virtual Asset Service Provider (VASP) license from Dubai’s dedicated regulator overseeing crypto operations.
OM’s price rally has been widely discussed on crypto X, with numerous industry participants predicting further gains in the near future. Altcoin Sherpa recently claimed the asset “has been easy to trade,” suggesting that investors should “just buy it and hold it.”
Ali Martinez also weighed in. On February 23, he maintained that OM is “breaking out of a bullish flag, with a potential target of $10.”
It is worth mentioning that Martinez touched upon the matter again on February 19. Back then, he envisioned a potential pullback, citing the formation of a sell signal on the 3-day chart. However, in the following days, OM’s price kept surging to the aforementioned peak.
The Bearish Scenario
People contemplating whether now is the right time to hop on the OM bandwagon should keep in mind some important factors. First, they must consider the current status of the crypto market, which has lately been in decline. A further collapse of the industry may have a domino effect and negatively impact the valuation of OM, too.
Next on the list is the Relative Strength Index (RSI). This technical analysis tool measures the speed and change of price movements to help traders identify potential reversal points. It varies from 0 to 100, with readings above 70 suggesting that the asset has entered overbought territory and could be due for correction. OM’s RSI recently surpassed the bearish zone and is currently set at around 65.
The post Is Mantra (OM) Headed for Another Rally After Hitting a New ATH? (Analysts) appeared first on CryptoPotato.