Is Local Bottom Confirmed for Cardano After a 40% Monthly Correction? (ADA Price Analysis)
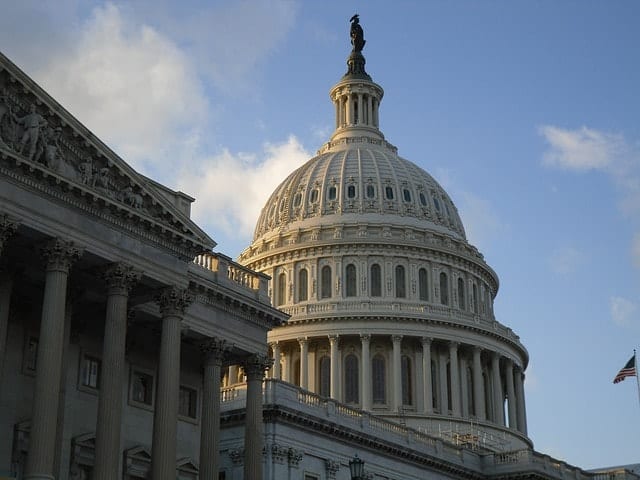
Key Support levels: $0.75
Key Resistance levels: $0.85, $0.91
ADA has returned to the key support at $0.75, which was last tested on February 24th. After a prolonged correction that happened over the course of a month, ADA appears to be giving some initial signs that it can reverse its downtrend. The first thing to consider would be if the price breaks above $0.85.
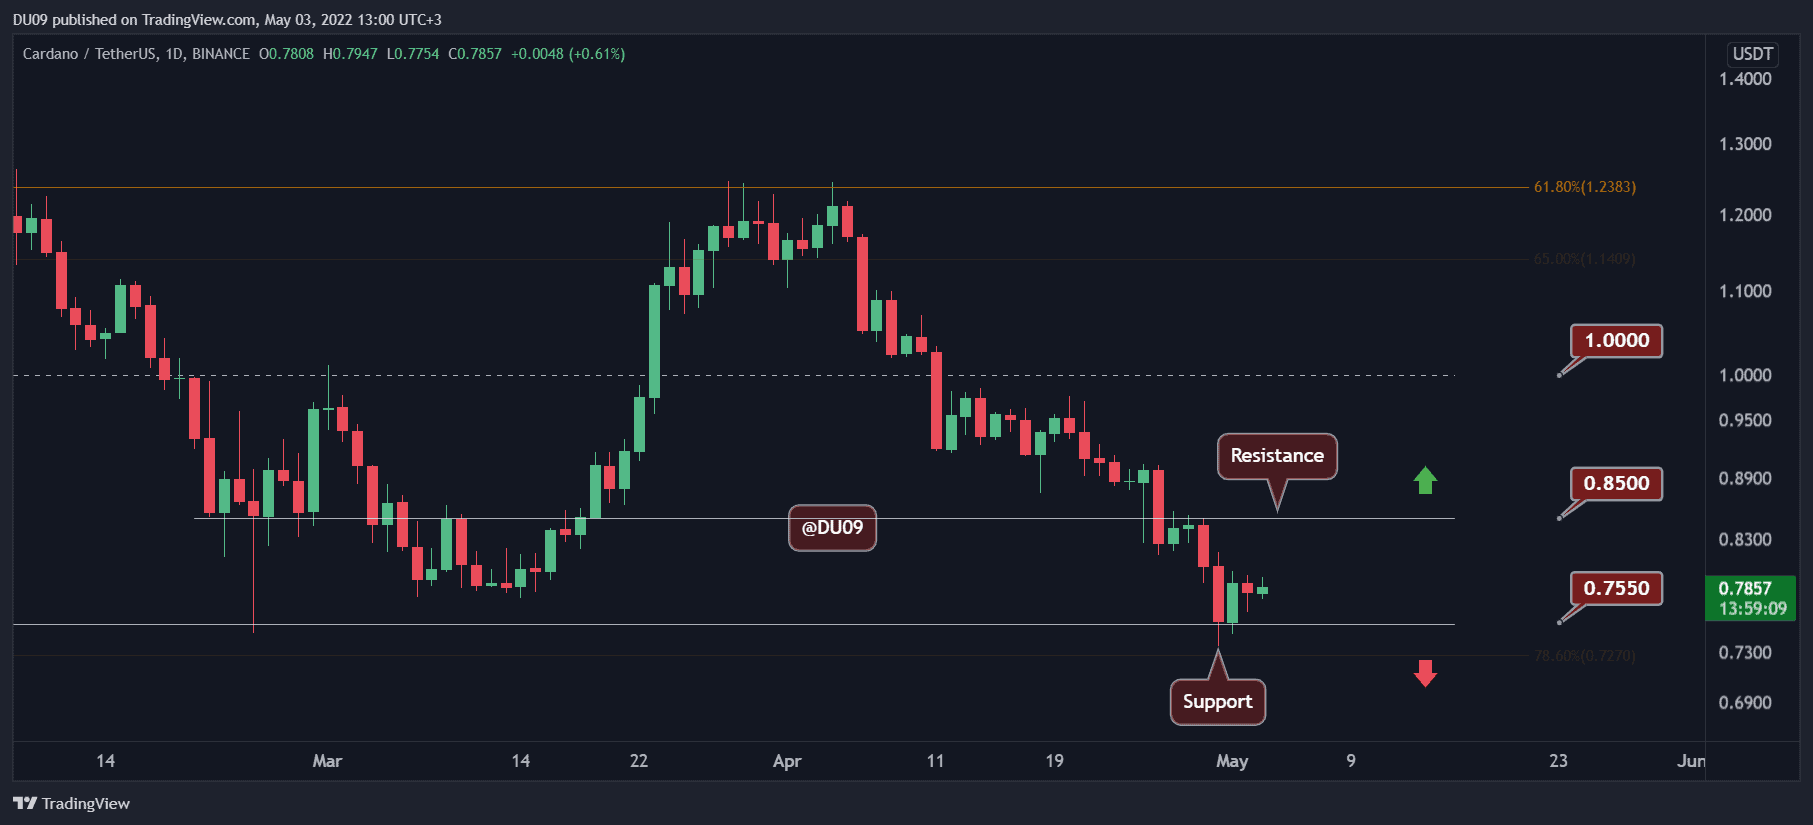
Technical Indicators
Trading Volume: The volume remains somewhat flat and balanced between bulls and bears, showing an equilibrium. This may form a good base for a possible reversal.
RSI: The daily RSI fell under 30 points at the end of April and quickly left the oversold area by making a higher low. If this trend continues, then buyers will have additional reasons to push prices higher.
MACD: The daily MACD remains bearish. However, it is making a bullish divergence on the histogram, and a positive flip becomes more likely if ADA can break the key resistance.
Bias
The bias for ADA is neutral. A break of the resistance at $0.85 would turn the bias bullish.
Short-Term Prediction for ADA Price
ADA has a real chance at a relief rally based on the price action and indicators. If Bitcoin stops the correction, which has pulled altcoins down as well, then ADA may be able to break above $0.85 in the coming week.