Is It a Good Time to Buy Bitcoin? At Least Judging by This Technical Indicator
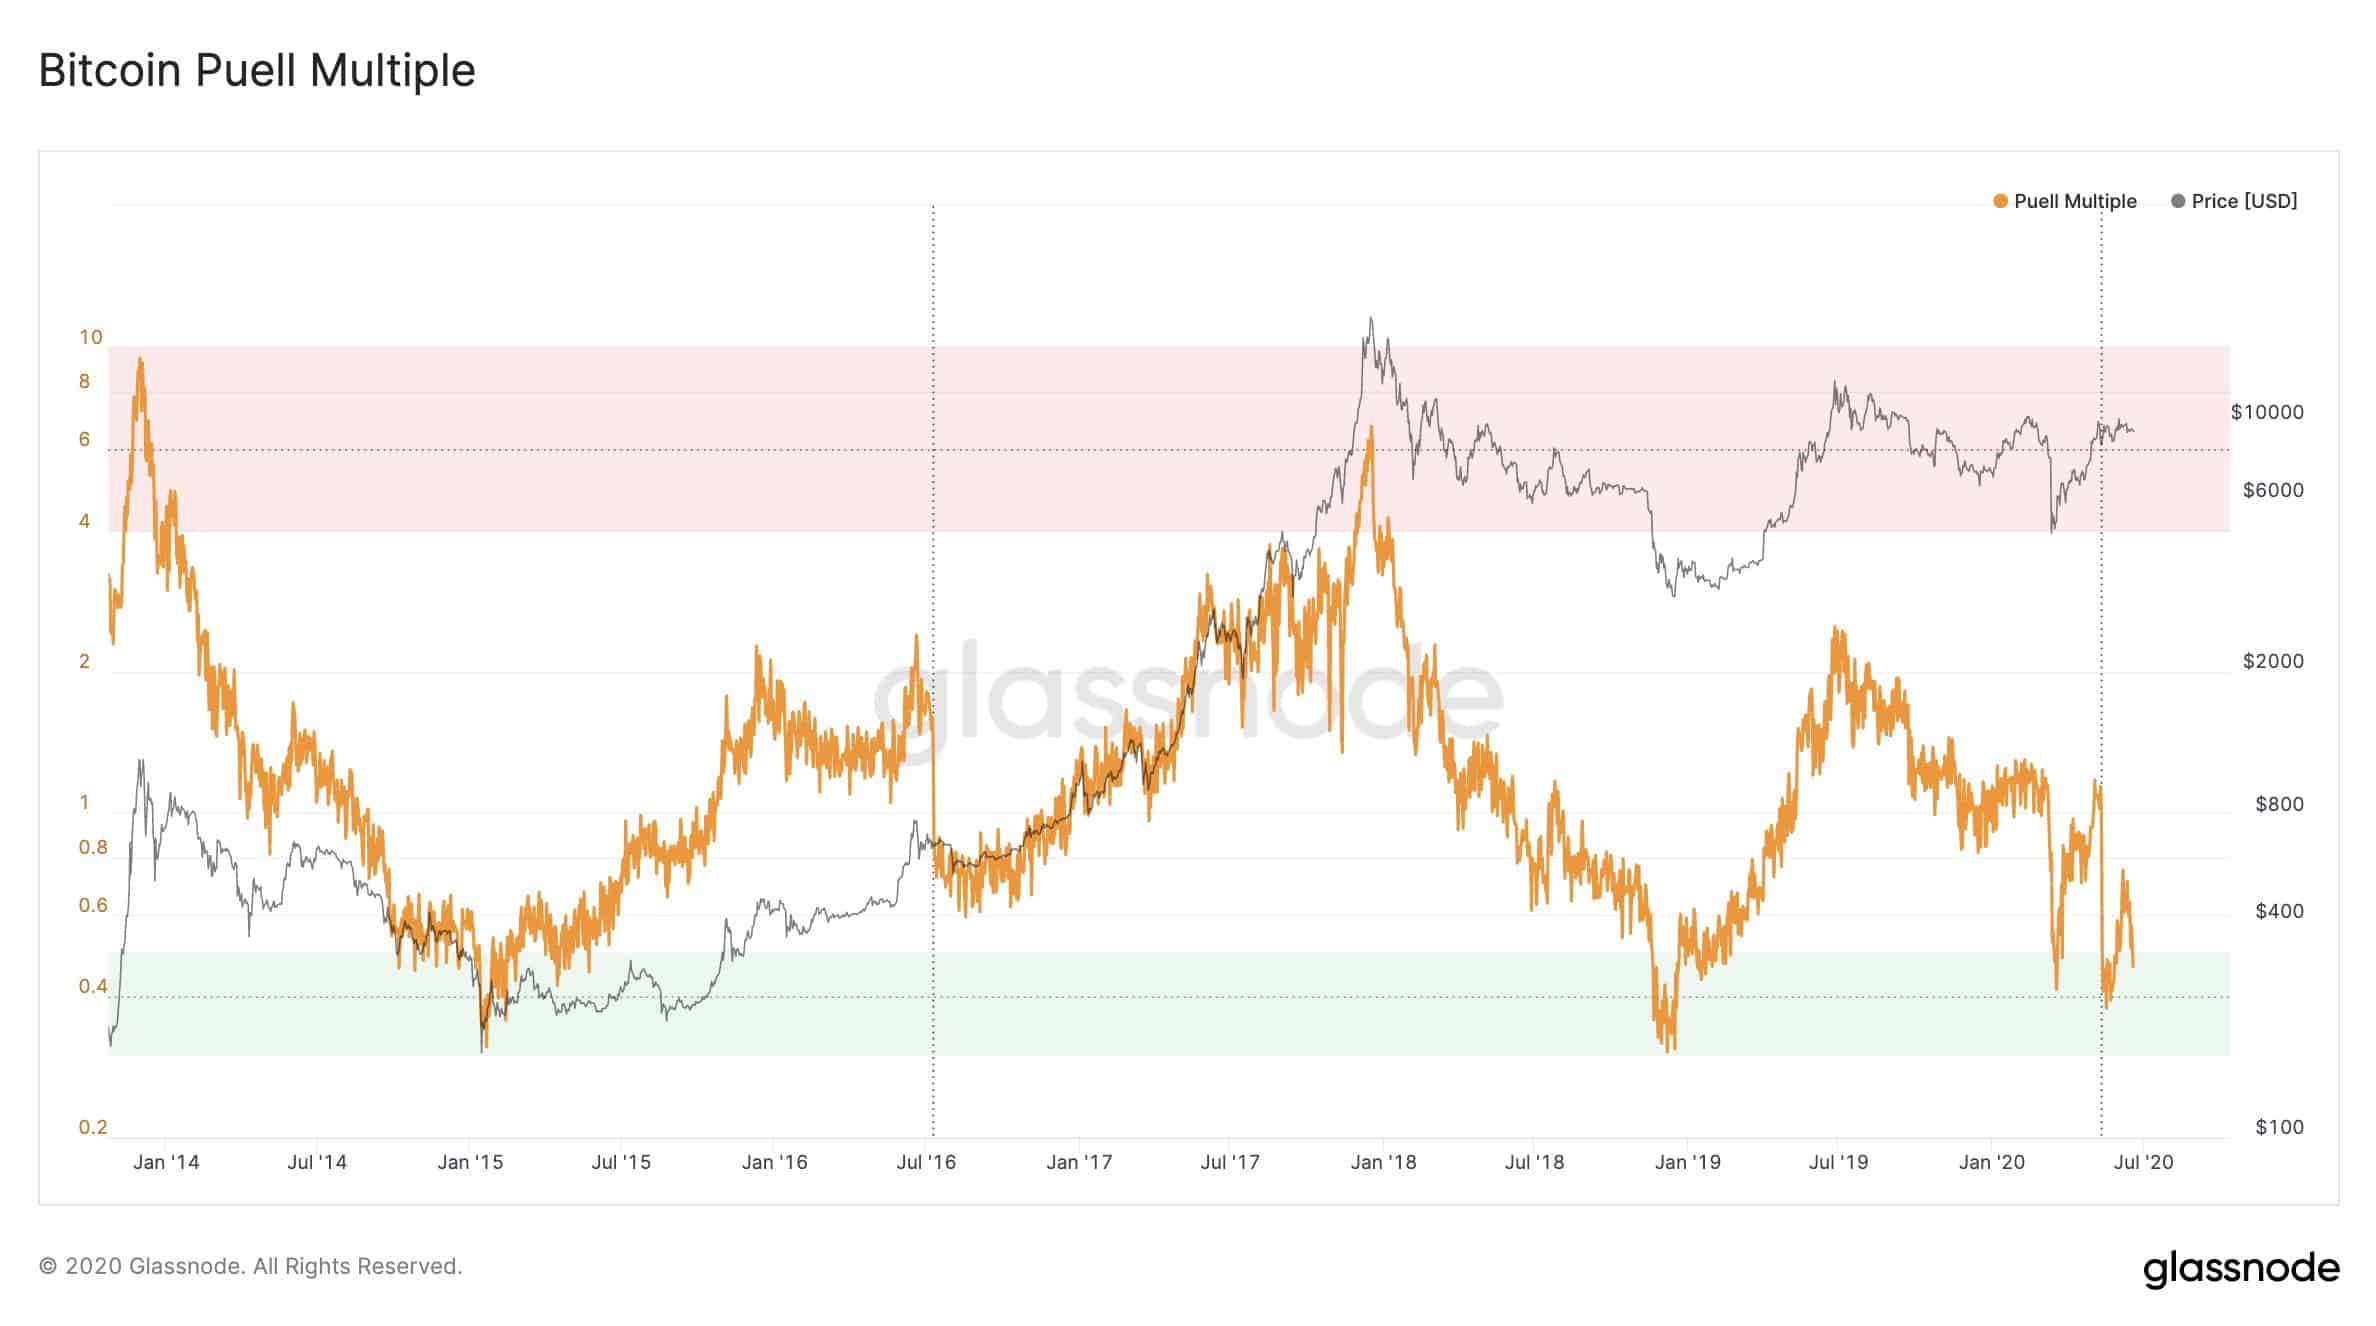
According to a popular metric, Bitcoin has dropped back in a “buy zone.” Historically, it has been an attractive point for investors to accumulate as a price surge has followed on most occasions.
Bitcoin’s PM Indicator Drops To 0.5
The Puell Multiple is a metric calculated by dividing the daily issuance value of bitcoins in USD by the 365-day moving average of the daily issuance value. Daily issuance is the number of freshly minted coins added to the ecosystem by miners after receiving them as block rewards.
Naturally, the daily issuance has altered significantly after the third halving on May 11th, 2020.
The cryptocurrency analytics company Glassnode evaluates the Puell Multiple in a ranking system. It starts from a low of 0.1, indicating an undervalued state, and it goes to a high of 10 – meaning the asset is overvalued.
Glassnode recently outlined Bitcoin’s current undervalued status as the metric has now dipped below the 0.5 line. The company tweeted that “Puell Multiple has dropped back into the green “buy” zone after almost three weeks.”

Puell Multiple Says Buy Bitcoin
Historically, Bitcoin hasn’t been below 0.5 too often since 2014. The first significant drop came in January 2015. At the time, BTC’s price plunged by more than 50% in a month from a high of $320 to a low of about $150.
The indicator stayed there for a few months, while the primary cryptocurrency was consolidating. When Bitcoin started ascending in price, the Puell Multiple followed.
The second clearly visible plunge came in late 2018, early 2019. This was in the months following the parabolic price increase, and Bitcoin was on its way down. In November 2018 alone, the asset price plunged from $6,400 to $3,500.
It took BTC a few months, but it finally began recovering in April and May 2019, before reaching the yearly high of nearly $14,000 in June. Somewhat expectedly, the Puell Multiple surged as well.
The metric arrived in the green zone earlier this year again after the entire market experienced the panic-selling effects of the COVID-19 pandemic. When BTC lost over 50% of its value in days and dipped below $4,000, the Puell Multiple went into the so-called “buy zone.”
In most previous cases, when the indicator has been in the green zone, Bitcoin’s price indeed spiked in the upcoming months. As such, Glassnode concluded that “for investors with long-term horizons these levels below the 0.5 line have historically marked excellent entry points into BTC.”
It’s also worth noting that Bitcoin has found itself twice in the “overvalued” state – the first time it happened following a monthly surge in late 2013 from $200 to nearly $1,200. The second time – during the mentioned above parabolic price increase when the asset reached its all-time high of almost $20k. After each such occasion, there was a severe rejection, and the price tumbled.
The post Is It a Good Time to Buy Bitcoin? At Least Judging by This Technical Indicator appeared first on CryptoPotato.


