Is Ethereum Due for a Bullish Breakout and a Surge to $2,000? (ETH Price Analysis)
After a brief bullish phase that brought optimism to the market, Ethereum’s price reached the 100-day moving average and faced increased selling pressure, resulting in a sharp decline.
However, the price is currently within a critical range, suggesting a potential consolidation scenario in the mid-term.
Technical Analysis
By Shayan
The Daily Chart
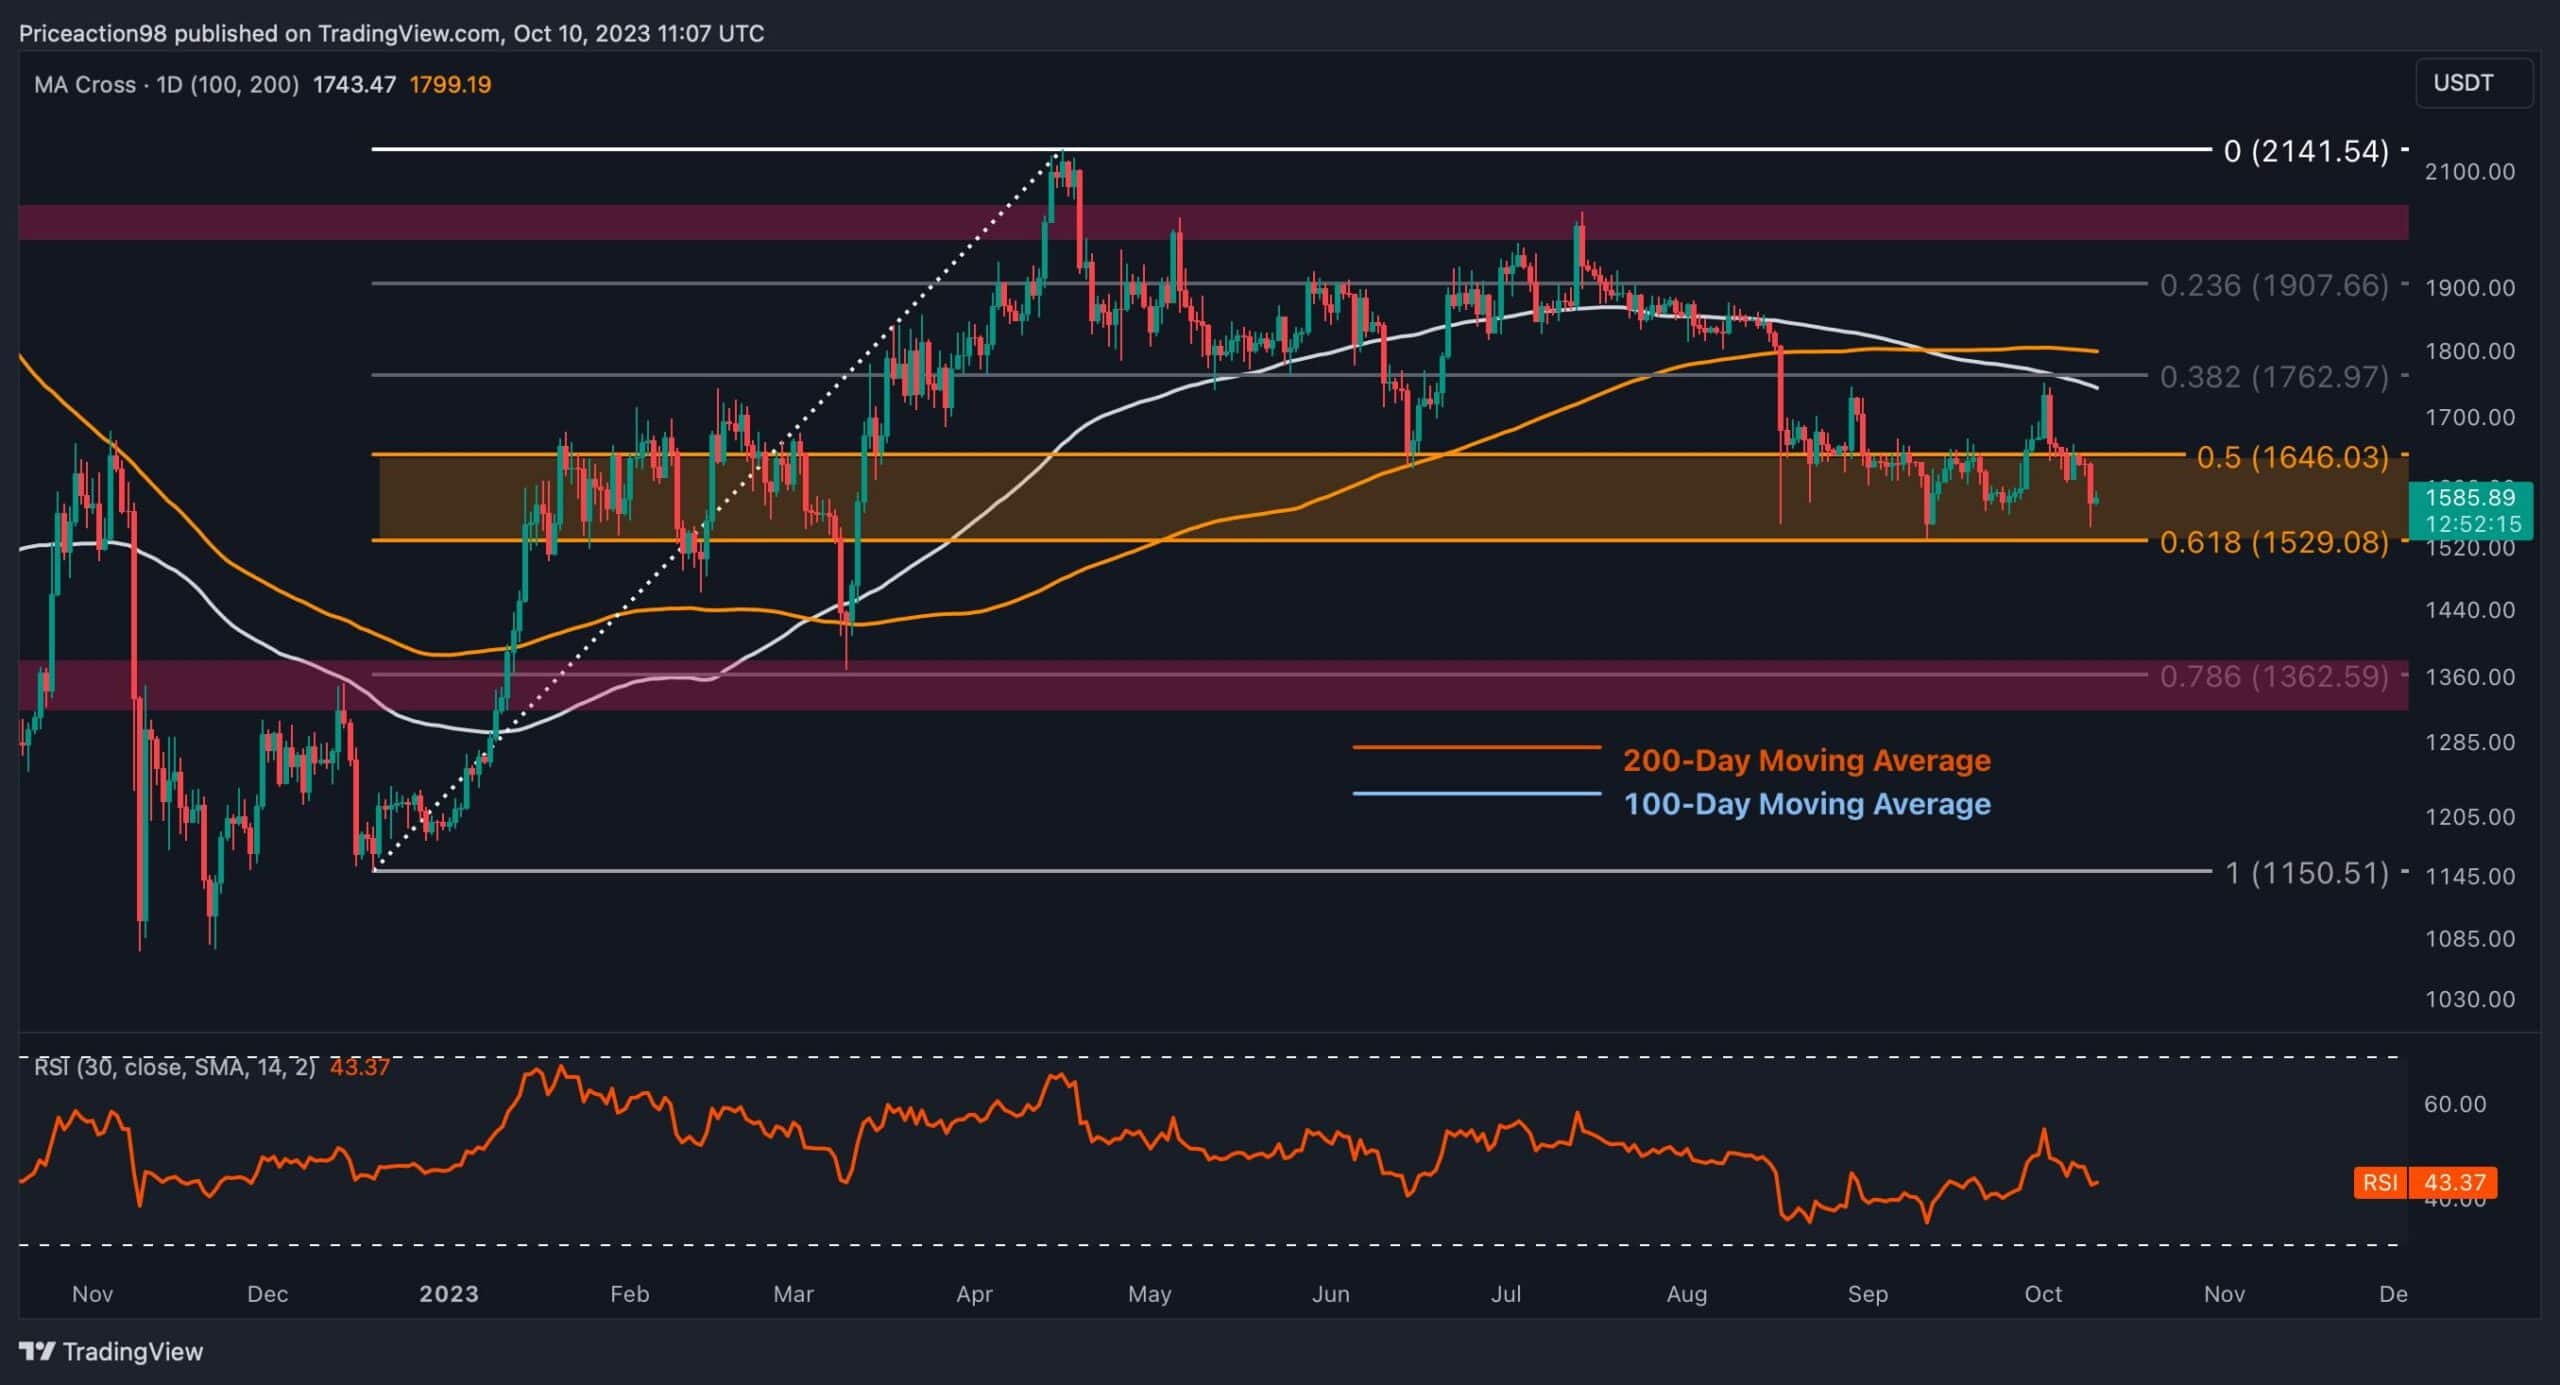
Upon examining the daily chart, Ethereum experienced a significant upward movement with strong bullish momentum after finding support around the $1.5K range. However, after it reached the 100-day moving average at approximately $1.7K, ETH faced substantial rejection, resulting in a steep downtrend. This price action completed a pullback to the broken 100-day moving average, indicating a highly bearish trajectory.
The only bullish indicator is the price encountering robust support within the range between the 0.5 and 0.618 levels of the Fibonacci retracement. This range serves as the bulls’ last line of defense, and a breach below it could trigger a sudden cascade in the market.
The 4-Hour Chart
Analyzing the 4-hour chart, it is evident that the price has predominantly followed a downward trend, forming a descending wedge pattern. However, ETH recently reached the crucial support level of $1.5K and found support, leading to a period of sideways movement within this range.
This sideways consolidation is confined between the $1.5K support and the notable $1.7K resistance. Therefore, the most likely scenario for Ethereum in the mid-term is a sideways consolidation until the price breaks out of this static range. The direction of Ethereum’s upcoming trend heavily depends on the direction of the breakout.
Regardless of the outcome, it is essential to closely monitor the price action in the coming days, as increased volatility can be expected, which will shape the market’s direction.

On-chain Analysis
By Shayan
Ethereum’s price has ultimately initiated an uptrend after failing to break below the $1.5K support region. Interestingly, the futures market is demonstrating a very bullish signal in contrast to Ethereum’s bearish price action.
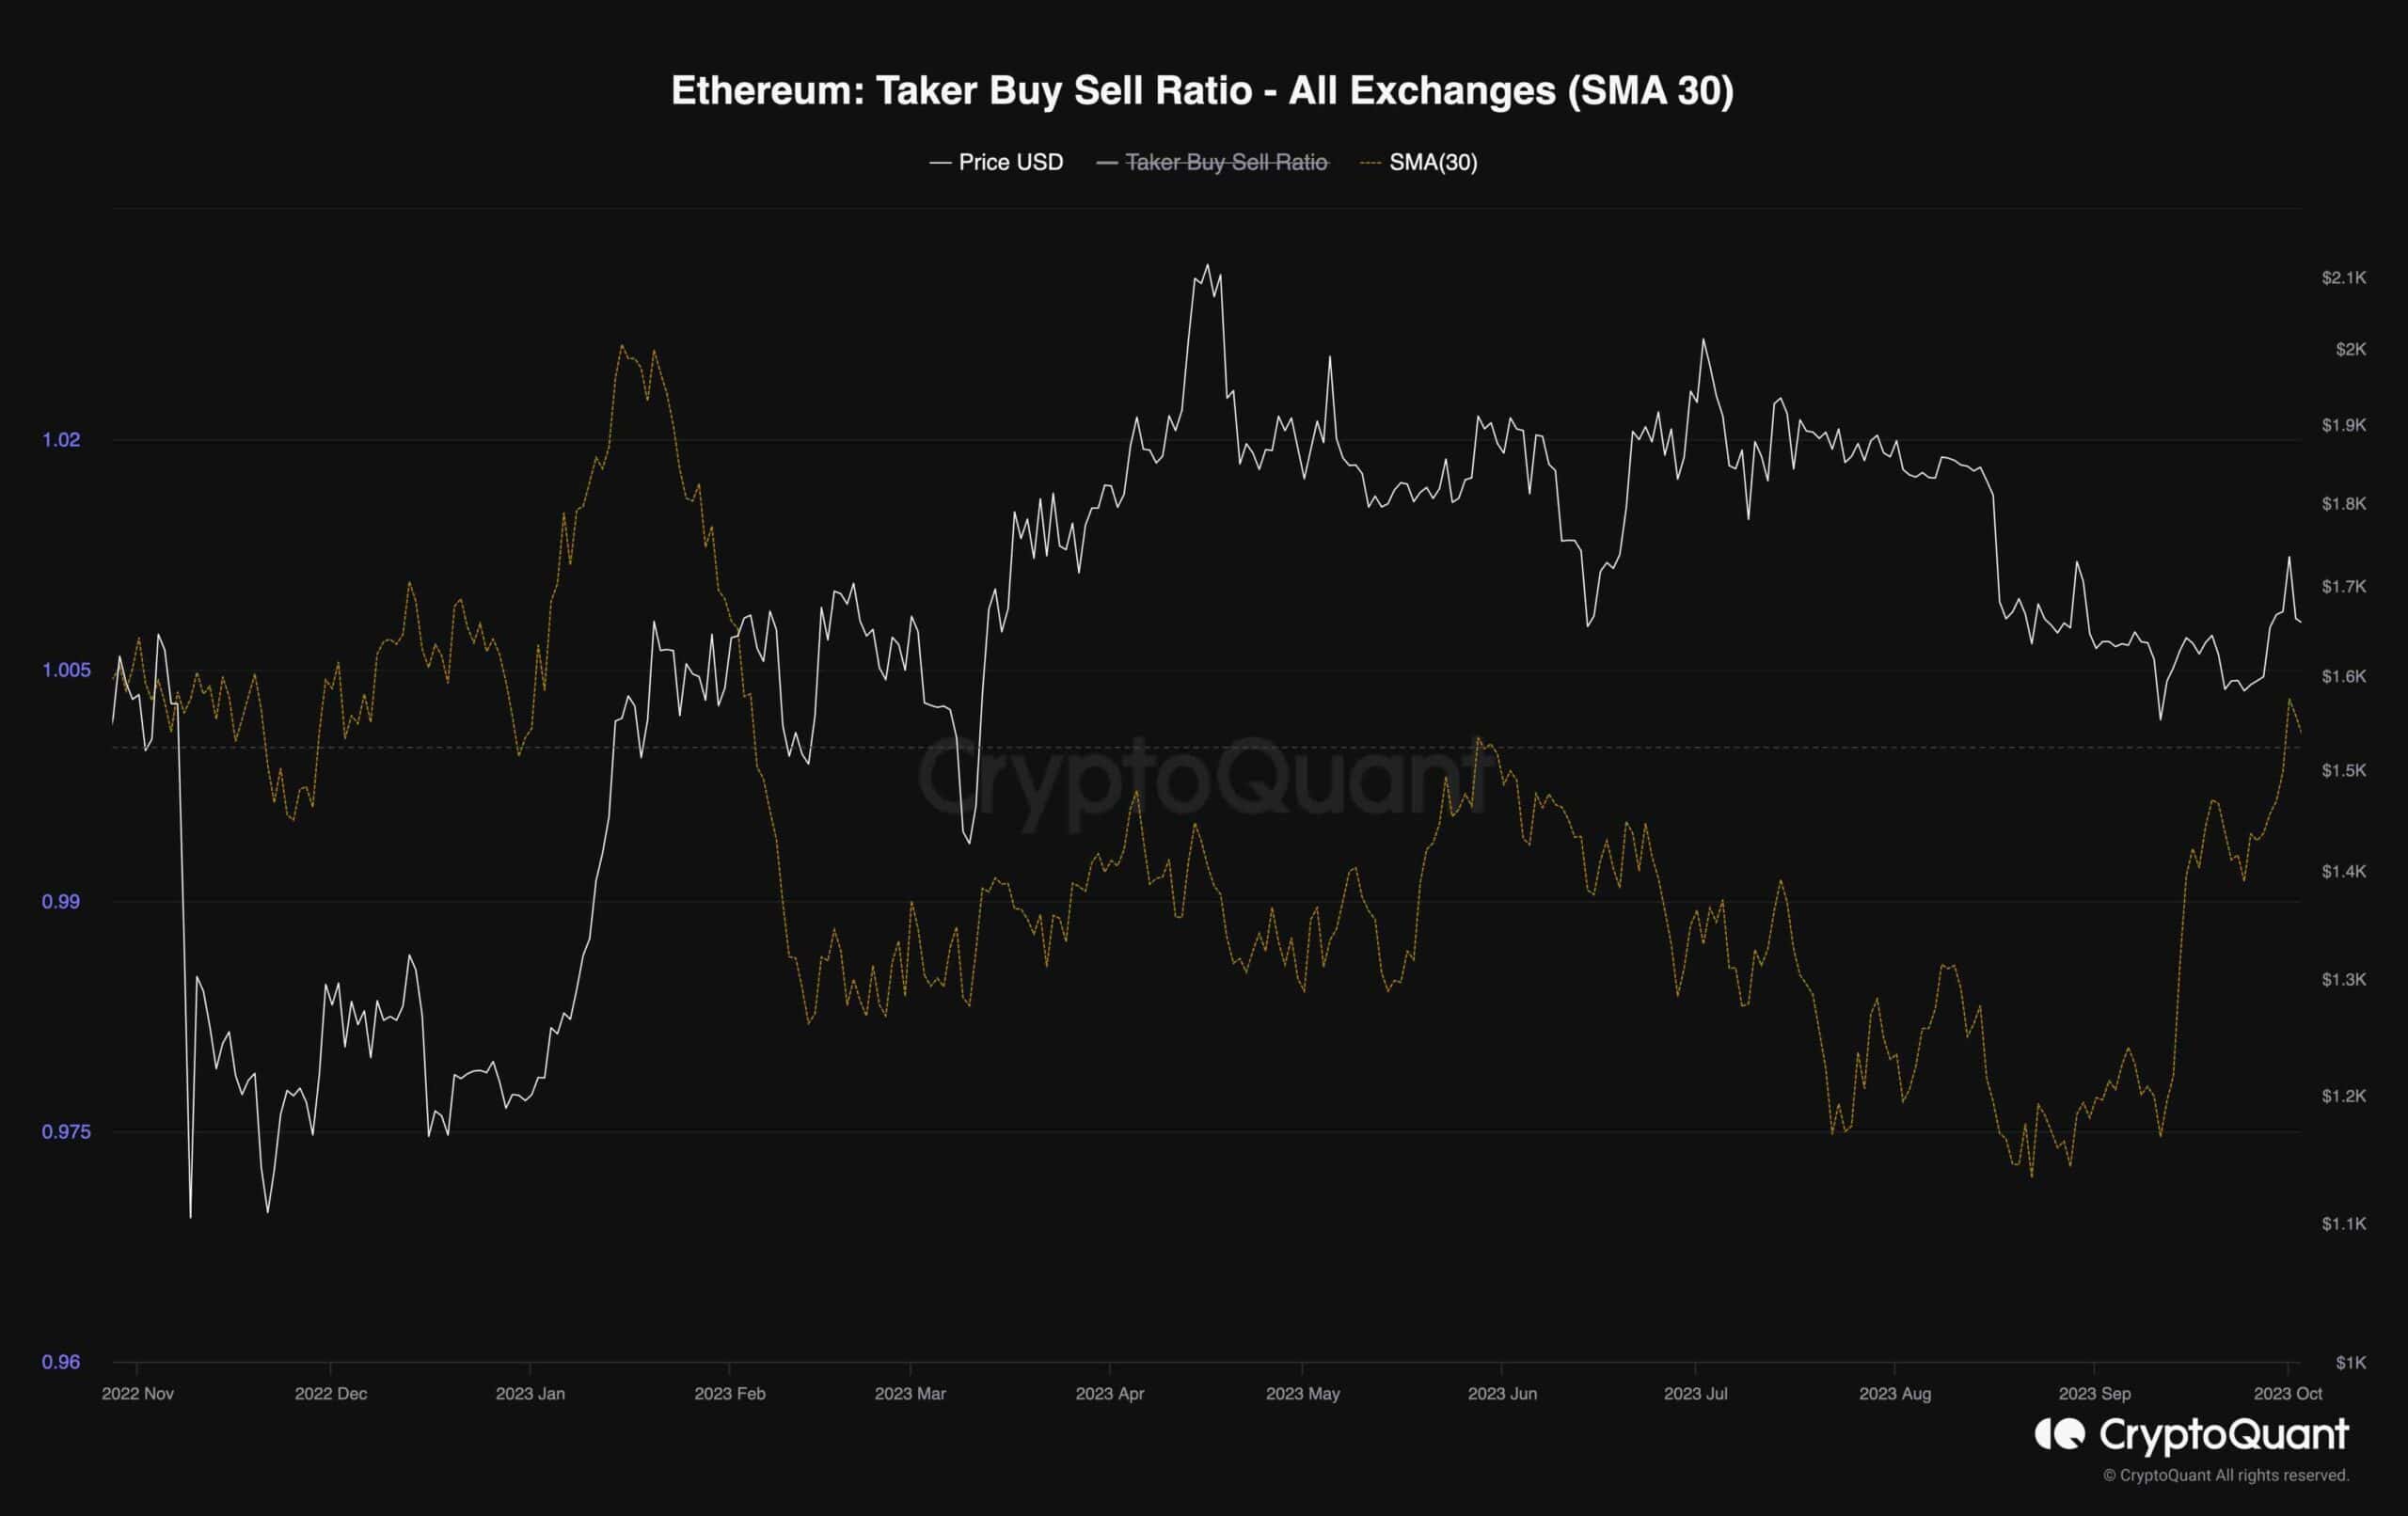
The chart represents the taker buy-sell ratio, which is one of the most useful metrics for evaluating futures market sentiment. Values above 1 are considered bullish, while values below 1 are bearish.
It is evident that after months of decline, the taker buy-sell ratio has recently spiked rapidly, surging above the 1 mark. This suggests the presence of aggressive buyers in the futures market. If this metric continues to trend upwards, it would likely lead to a new bullish stage in the market, with the price aiming for a significant resistance zone of $2K in the coming months.
The post Is Ethereum Due for a Bullish Breakout and a Surge to $2,000? (ETH Price Analysis) appeared first on CryptoPotato.