Is BTC About to Skyrocket to $69K This Week? (Bitcoin Price Analysis)
Bitcoin’s price is fast approaching its all-time high of $69K, and the probability of making a new record high is very significant in the short term.
Technical Analysis
By TradingRage
The Weekly Chart
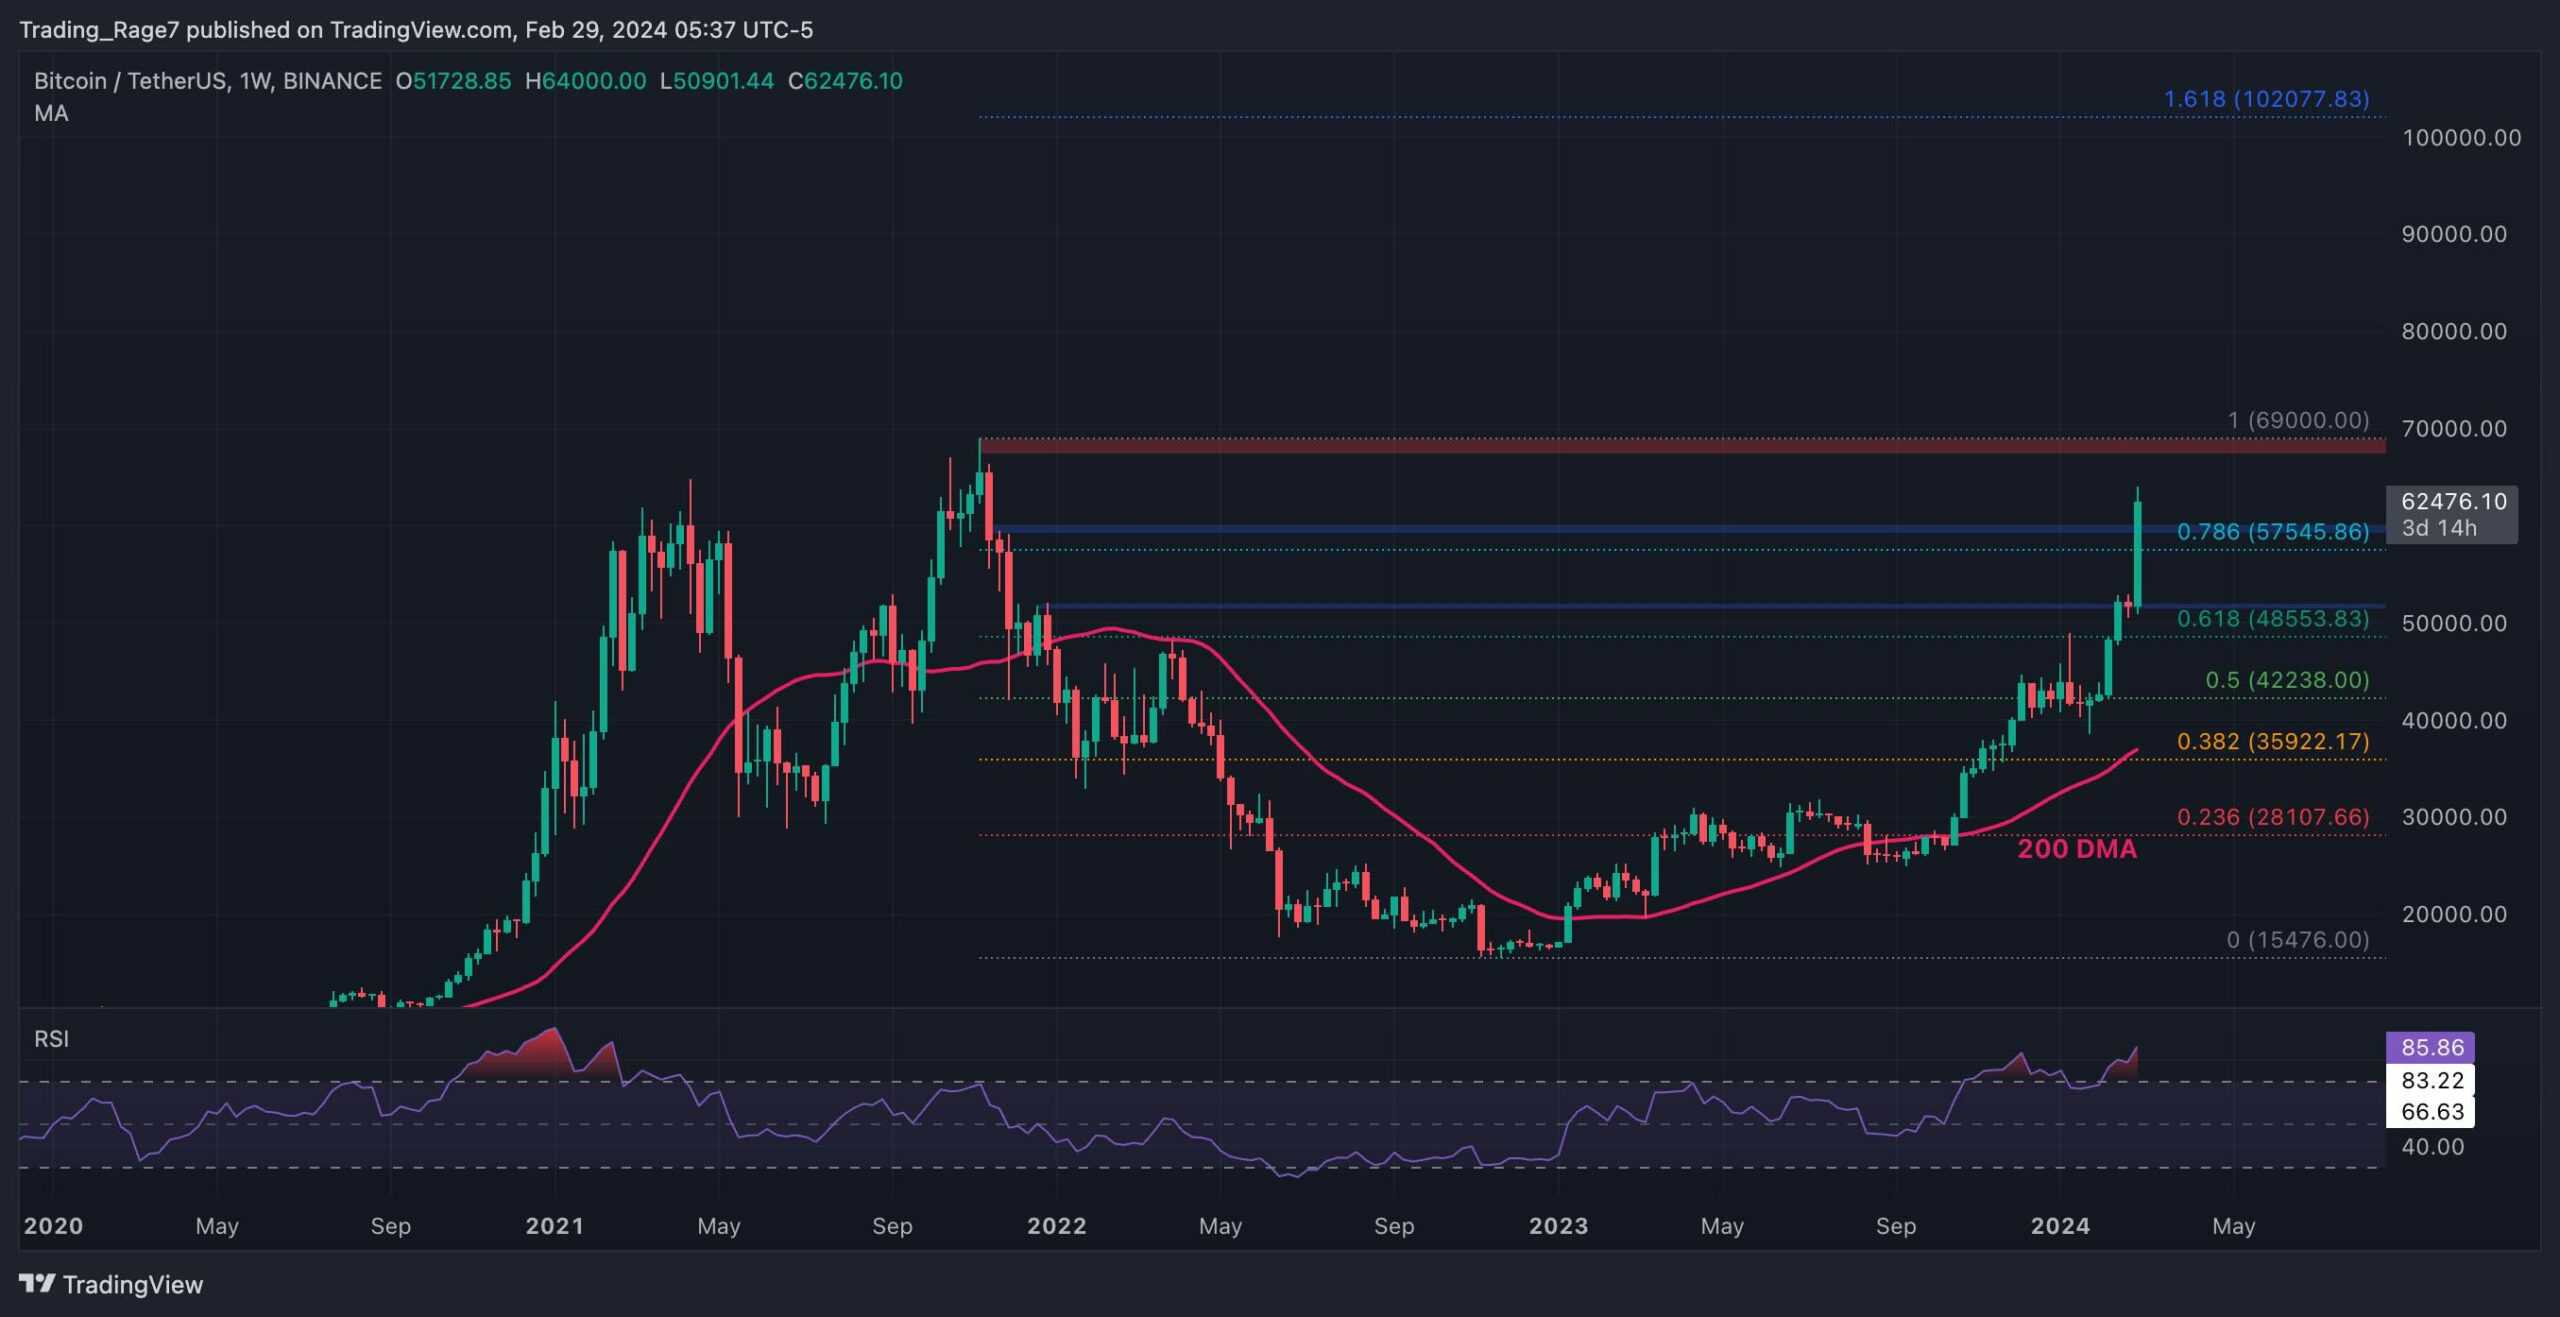
On the weekly chart, the price has been rallying consistently since retesting the 200-day moving average and rebounding higher a few months ago.
The price has recently broken the $60K level and is targeting the $69K all-time high. Moreover, according to the inverse Fibonacci retracement, the $100K mark is a target for Bitcoin in the coming weeks. Yet, the continuation of this rally might materialize after a correction in the short term.

The Daily Chart
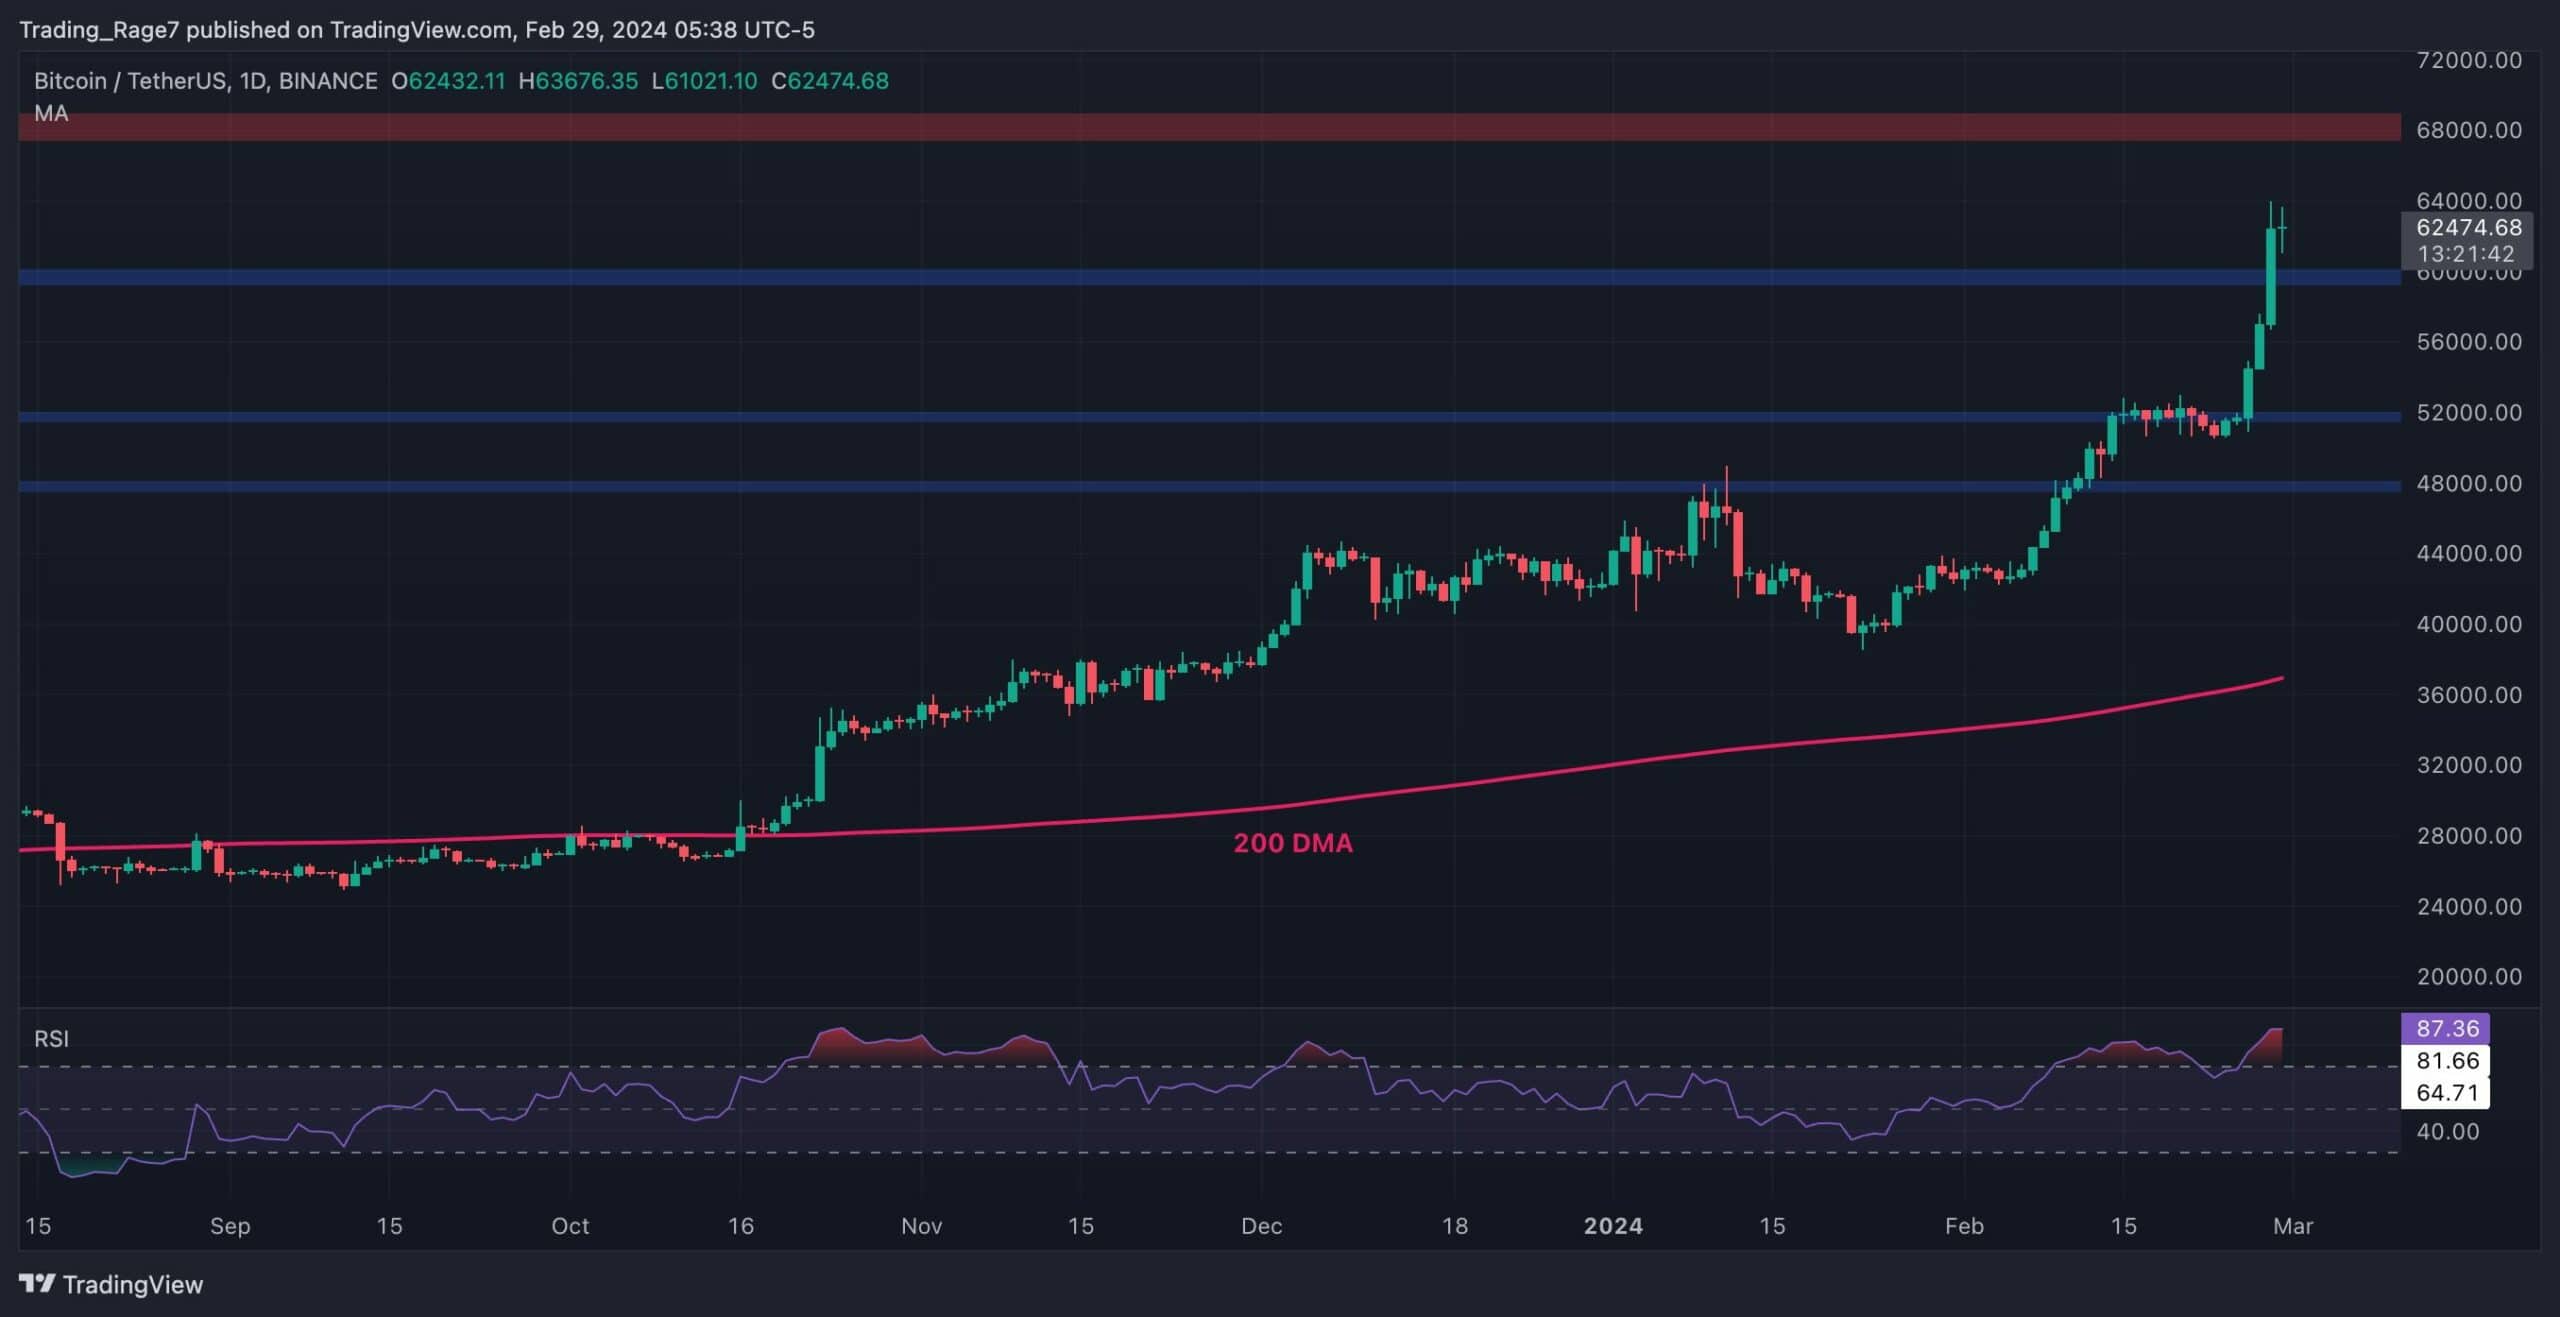
Looking at the daily chart, the price has broken past several resistance levels in the past few weeks. It has recently broken above the $60K level with momentum, and the next target is the all-time high level of $69K.
The relative strength index (RSI), however, demonstrates a massive overbought signal. This could lead to a correction in the short term, either before making a new all-time high or afterward.

On-Chain Analysis
By TradingRage
Bitcoin Miners Position Index (MPI)
While Bitcoin’s price is approaching its all-time high aggressively, analyzing miners’ behavior might provide beneficial insight into market dynamics. Miners are the most significant cohort in the Bitcoin network, as they provide security for the network and hold substantial amounts of BTC.
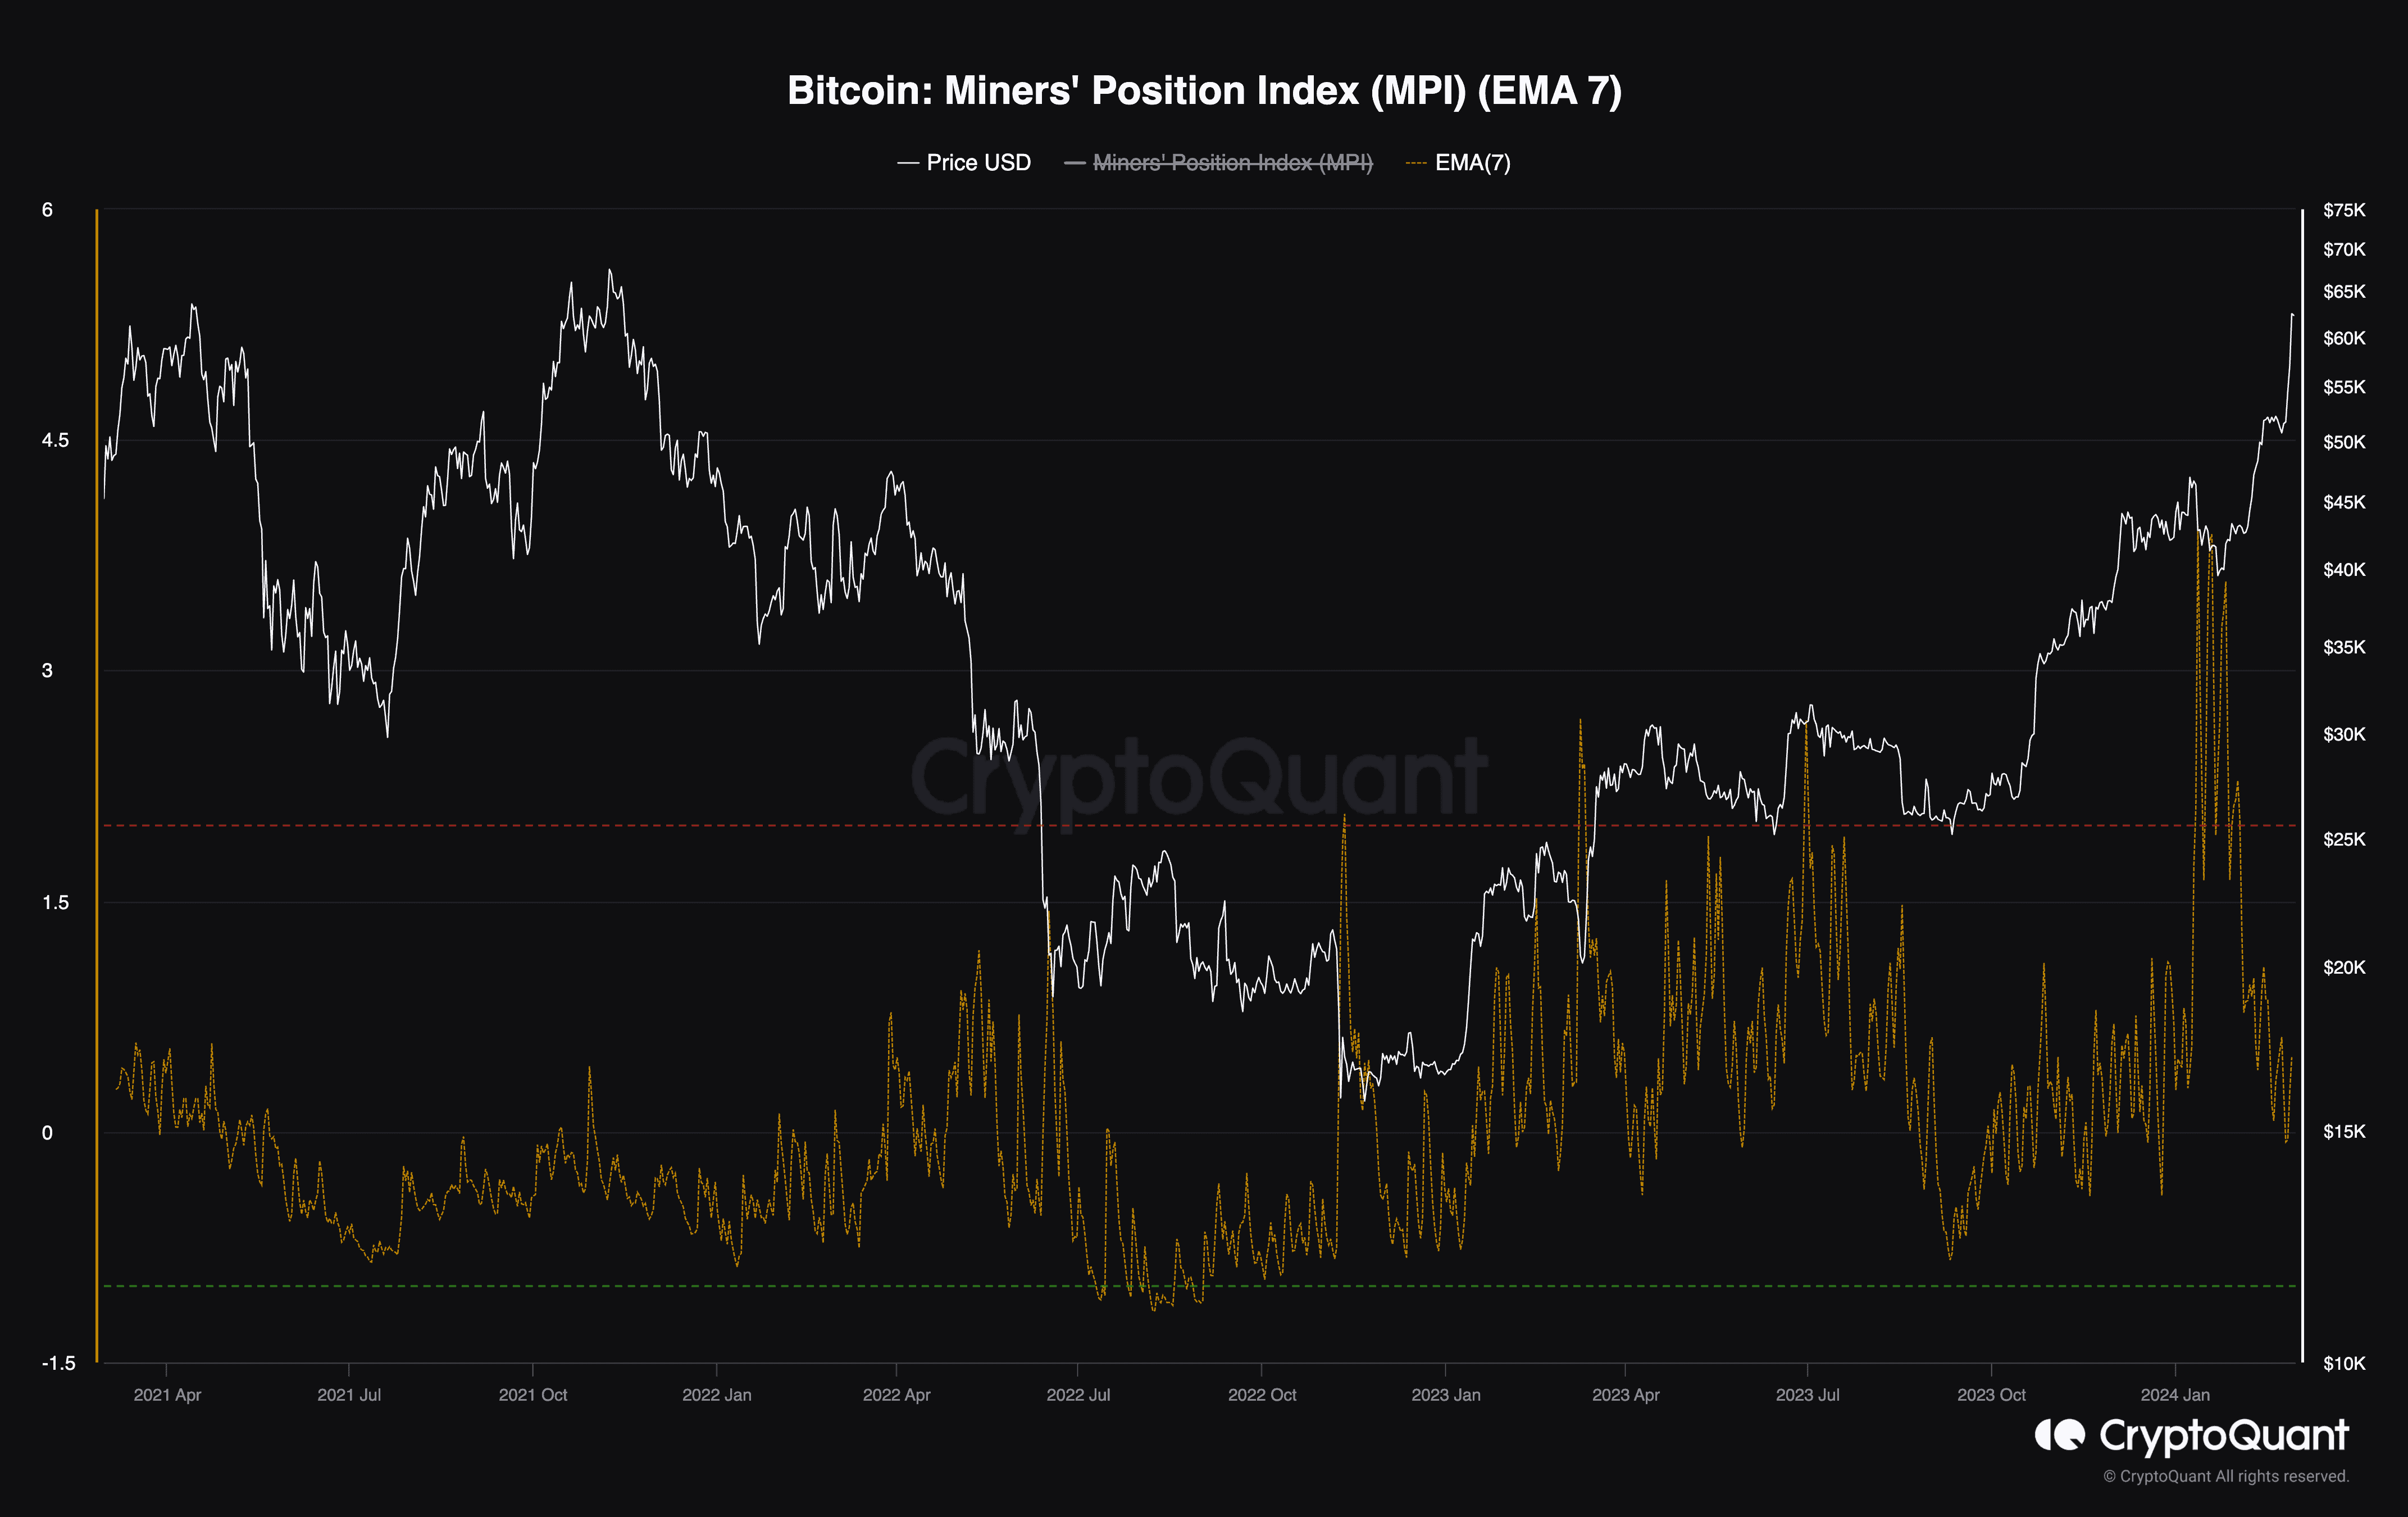
This chart presents the Miners Position Index (MPI). The MPI metric measures the magnitude of miners’ selling relative to its one-year average. As a result, higher values indicate heavy distribution by miners, while lower values can indicate holding or accumulation.
As the chart demonstrated, the MPI has fallen significantly in the last couple of weeks, as BTC has approached its all-time high. In case this behavior continues, the lack of supply by miners can lead to further price increase in the coming months.

The post Is BTC About to Skyrocket to $69K This Week? (Bitcoin Price Analysis) appeared first on CryptoPotato.


